Data compilation FY2021 (Environmental report)
Action 2 <Minimum CO2 Monozukuri>
CO2 emissions basic unit of the DENSO Group
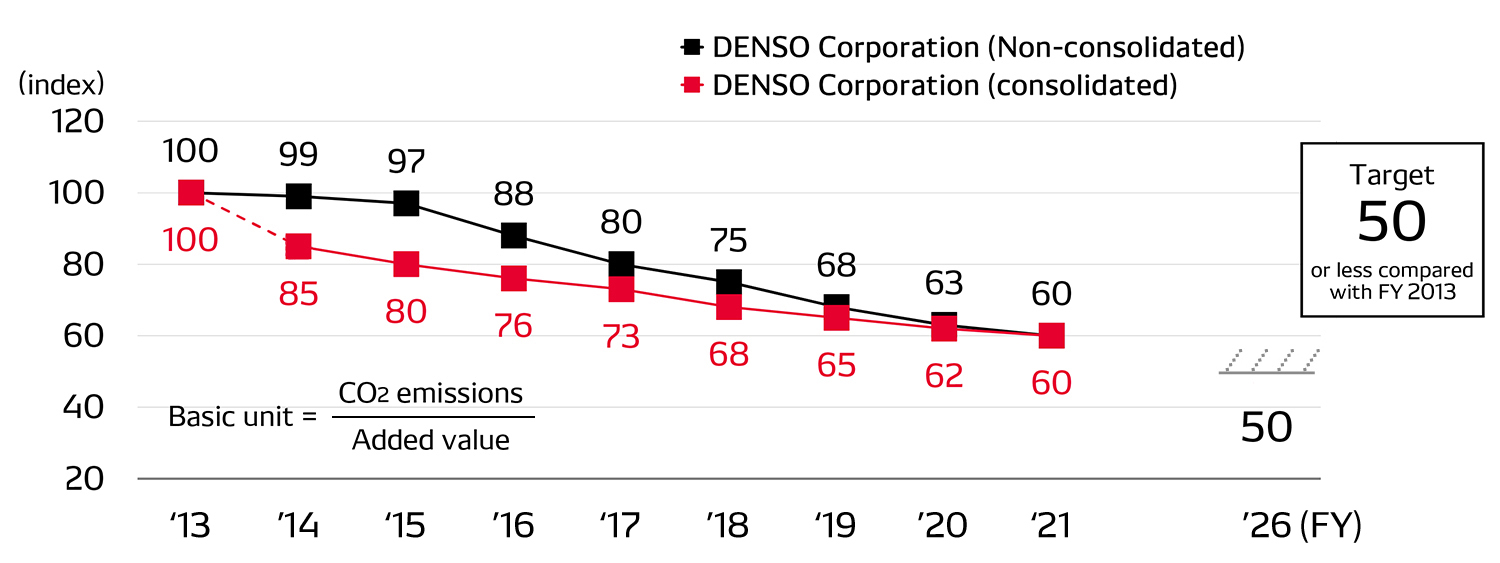
CO2 Emissions of the DENSO Group (Scope 1 and Scope 2)
(Thousands of t-CO2)
| Fiscal 2019 | Fiscal 2020 | Fiscal 2021 | |
|---|---|---|---|
| DENSO CORPORATION | 852 | 841 | 819 |
| Domestic Group companies | 317 | 277 | 264 |
| Overseas Group companies | 738 | 766 | 700 |
| Total (Scope 1 and Scope 2) | 1,907 | 1,883 | 1,784 |
| Fiscal 2019 | Fiscal 2020 | Fiscal 2021 | ||
|---|---|---|---|---|
| Scope 1 | DENSO CORPORATION | 437 | 449 | 428 |
| Domestic Group companies | 82 | 57 | 56 | |
| Overseas Group companies | 156 | 205 | 199 | |
| Scope 2 | DENSO CORPORATION | 415 | 392 | 391 |
| Domestic Group companies | 235 | 220 | 208 | |
| Overseas Group companies | 582 | 560 | 502 | |
| Total | 1,907 | 1,883 | 1,784 | |
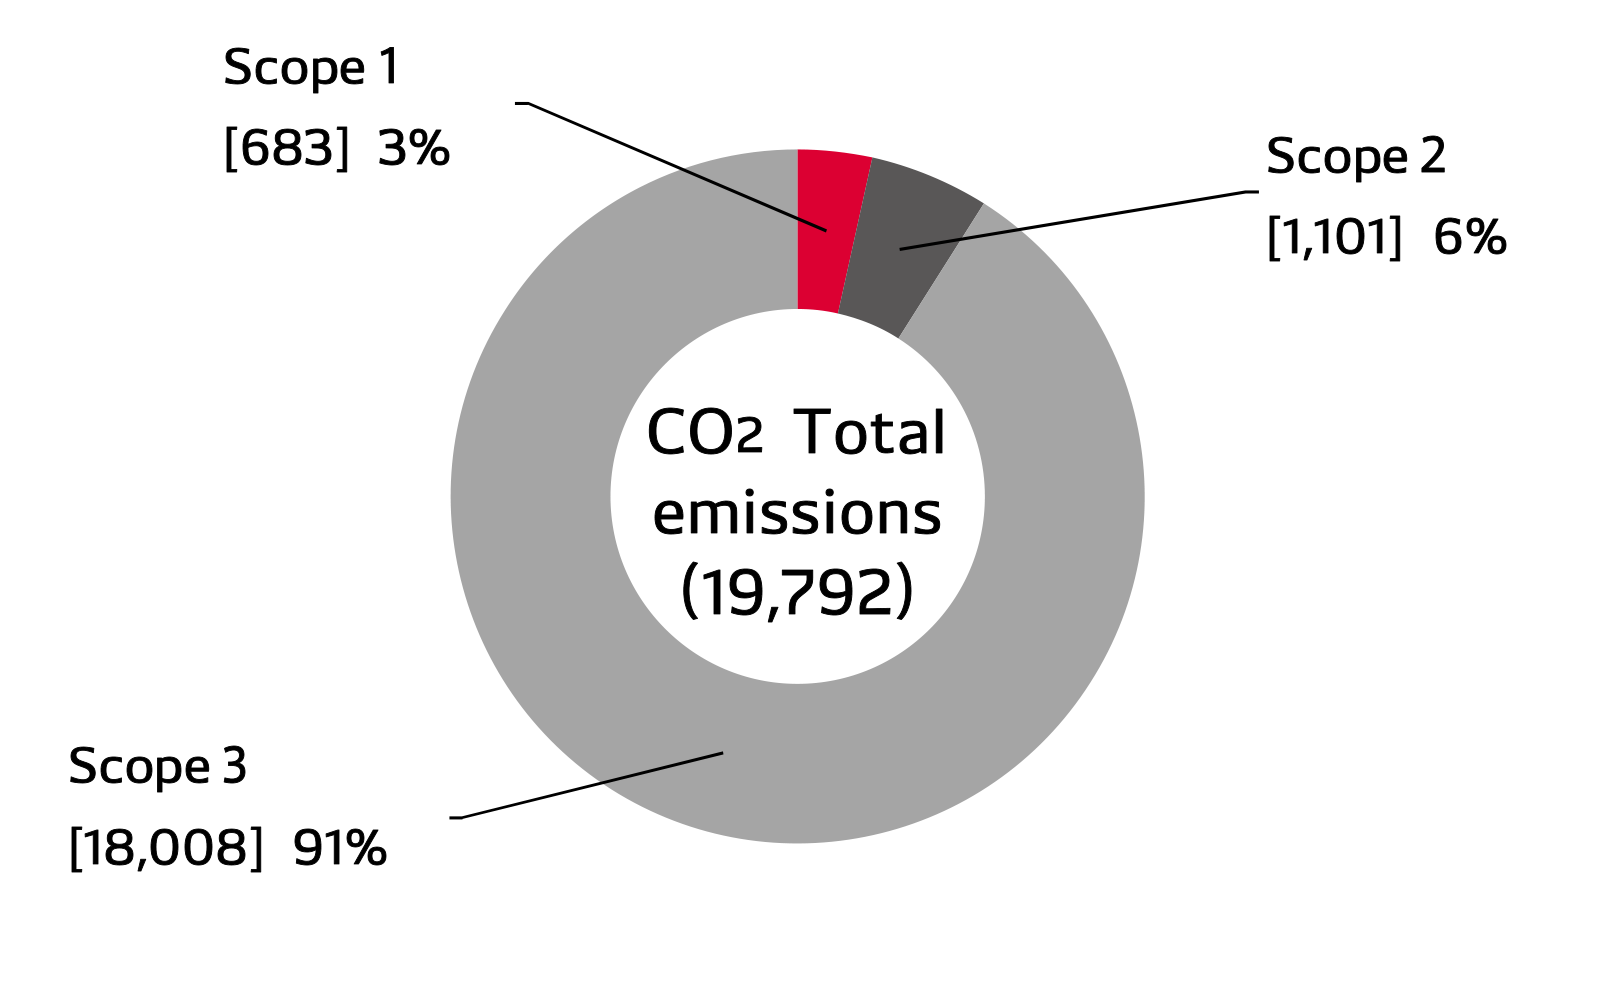
Proportion of total CO2 emissions throughout value chain
The proportions expressed in the graph are based on the international guideline "GHG Protocol Scope 3 Standard" related to the calculation and reporting of CO2 emissions throughout the value chain.
* Of the "scopes" (scope of emissions) for greenhouse gases: (a) Scope 1 emissions are direct GHG emissions from the entity such as gasoline or the combustion of heavy oil; (b) Scope 2 emissions are indirect GHG emissions resulting from the generation of electricity; and (c) Scope 3 emissions include indirect GHG emissions from related activities undertaken outside of the entity such as raw material procurement, production, disposal, logistics, and sales.
Global CO2 Emissions of the DENSO Group (Fiscal 2021) (Thousands of t-CO2)
| Scope 3 category | Emissions amount (Thousands of tons) |
Notes |
|---|---|---|
| 1. Purchased goods and services | 7,661 * | |
| 2. Capital goods | 1,288 | |
| 3. Fuel- and energy-related activities (excluding Scope 1 and Scope 2) |
233 | |
| 4. Transportation and distribution (upstream) |
52 | |
| 5. Waste generated from operations | 38 | |
| 6. Business travel | 22 | |
| 7. Employee commuting | 80 | |
| 8. Leased assets (upstream) | - | Recorded in Scope 2 |
| 9. Transportation and distribution (downstream) |
- | Recorded in 4. Transportation and distribution (upstream) |
| 10. Processing of sold products | - | No relevant businesses |
| 11. Use of sold products | 8,601 * | |
| 12. End-of-life treatment of sold products | 33 | |
| 13. Leased assets (downstream) | - | No relevant businesses |
| 14. Franchises | - | No relevant businesses |
| 15. Investments | - | No relevant businesses |
| 16. Other (upstream and downstream) |
- | No relevant businesses |
| Scope 3 total | 18,008 |
*The CO2 emissions of "1. Purchased raw materials" and "11. Use of sold products" are being verified by an external organization.
| Fiscal 2019 | Fiscal 2020 | Fiscal 2021 | |
|---|---|---|---|
| The DENSO Group | 22,880 | 18,874 | 18,008 |
* CO2 emissions of DENSO CORPORATION, Domestic Group companies and Overseas Group companies are proceeding with verification by external organizations (scopes 1, 2 and part of scope 3, FY2020 and FY2021). Along with that, we may be reviewing the calculation range and method of past data.
| Fiscal 2019 | Fiscal 2020 | Fiscal 2021 | |
|---|---|---|---|
| CO2 | 1,169 | 1,118 | 1,083 |
| CH4 | 12 | 12 | 10 |
| N2O | 3 | 3 | 3 |
| HFCs | 22 | 2 | 2 |
| PFCs | 39 | 49 | 55 |
| SF6 | 8 | 11 | 11 |
| Others | 2 | 0 | 0 |
For reference: Basic rationale on the calculation of total greenhouse gas emissions
At DENSO, all greenhouse gases defined in the Kyoto Protocol are cumulatively calculated, specifically, CO2 (an energy-related greenhouse gas) and five gases (non-energy-related greenhouse gases), including PFC, HFC, SF6, N2O, and CH4. The emission coefficient set by region is the conversion factor for CO2 at DENSO.
In Japan, the Company uses the conversion factors shown in the table below. Outside Japan, DENSO uses the factors publicly announced in each global region.
Please note that in this report the reduction effect of CO2 by co-generation is converted by the average of conversion factors for different types of thermal power generation. The effect of co-generation is included in the CO2 emissions of the Company. As for the emissions of the five gases, from fiscal 2007, the Company began using the instructions of the Law Concerning the Promotion of the Measures to Cope with Global Warming enacted and enforced in Japan.
Conversion factors for CO2 used in the calculation of CO2 emissions
| Electricity | 0.453kg-CO2/kWh |
|---|---|
| Heavy fuel oil (A) | 2.71kg-CO2/L |
| Kerosene | 2.489kg-CO2/L |
| Propane | 2.999kg-CO2/kg |
| Light crude oil | 2.585kg-CO2/L |
| City gas | 2.171kg-CO2/m3 |
* Reference of conversion factor for CO2: Japan Auto Parts Industries Association
Domestic Volume of Energy Used (DENSO CORPORATION)
(GJ)
| Fiscal 2019 | Fiscal 2020 | Fiscal 2021 | |
|---|---|---|---|
| Scope 1 | 9,209,974 | 9,622,392 | 9,021,261 |
| Scope 2 | 8,931,464 | 9,189,391 | 8,411,763 |
| Total | 18,141,438 | 18,811,784 | 17,433,024 |
CO2 emissions from logistics [DENSO CORPORATION]
| FY | FY2013 (Base year) |
・・・ | FY2017 | FY2018 | FY2019 | FY2020 | FY2021 |
|---|---|---|---|---|---|---|---|
| 1,000t-CO2 | 34.4 | 33.6 | 34.3 | 41.8 | 43.2 | 40.4 |
Amount of CO2 emissions in logistics / Physical production and sales (Unit: 100 million yen) [DENSO Corporation]
-
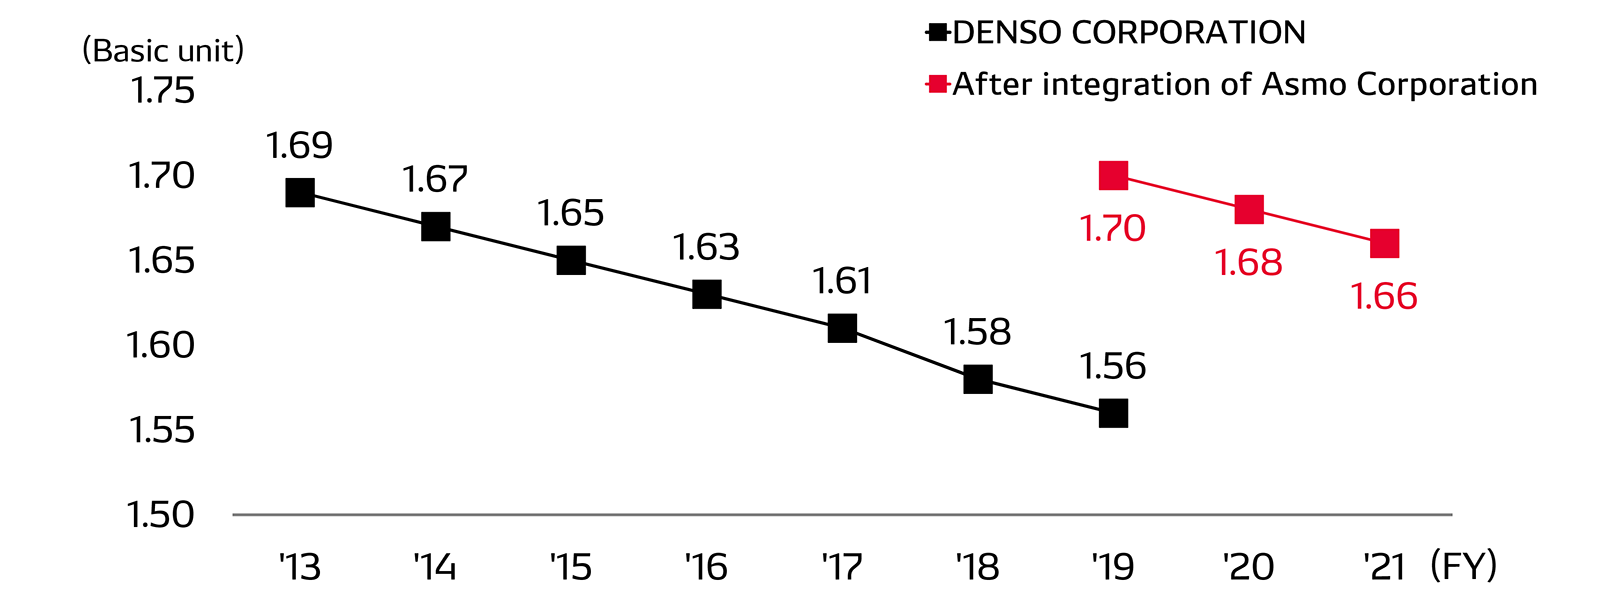
*Asmo Corporation was integrated into Denso Corporation (April 2018).
Action 4 <Eco-Materials & Low-Emissions>
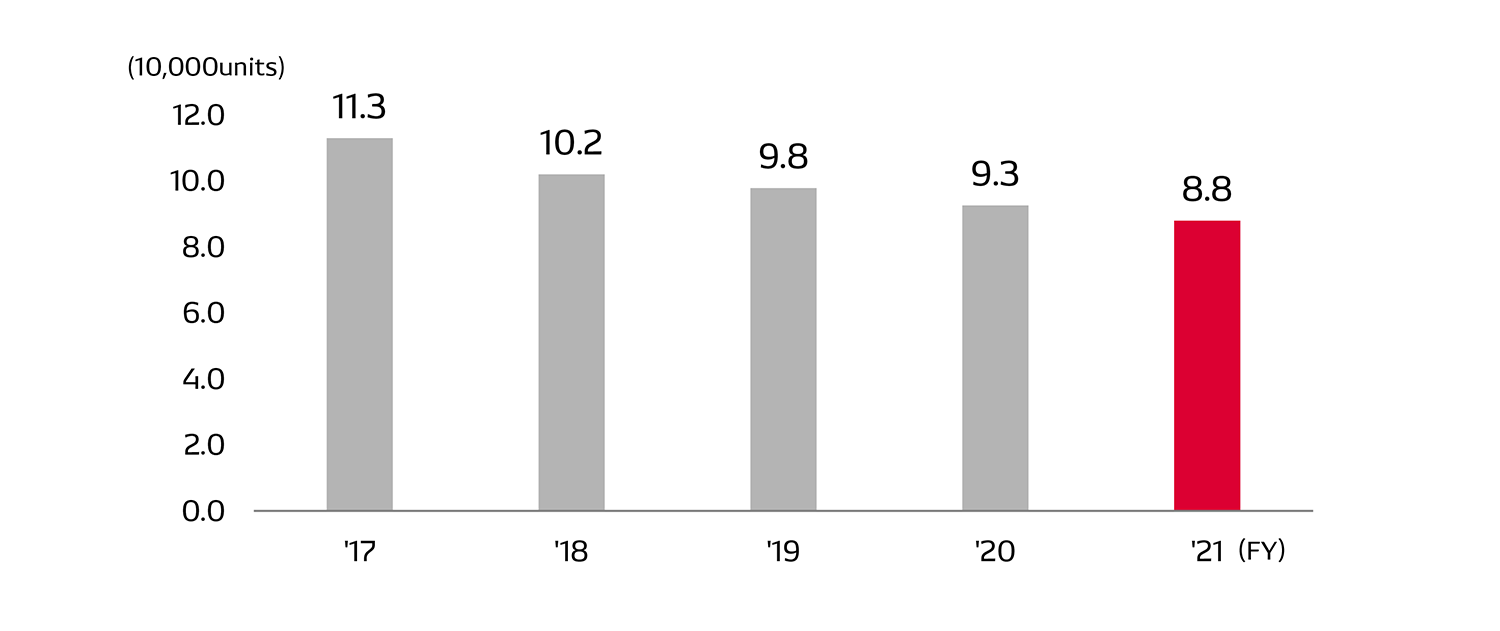
Product reconditioning volumes at DENSO REMANI [Japan]
Action 5 <Minimum Environmental Impact Production>
(1)Water
Domestic Water Intake (Usage) Volume (DENSO CORPORATION + Domestic Group Companies)
(Ten thousands of tons)
| Fiscal 2016 | Fiscal 2017 | Fiscal 2018 | Fiscal 2019 | Fiscal 2020 | Fiscal 2021 | |
|---|---|---|---|---|---|---|
| Water Intake Volume | 1,183 | 1,142 | 1,204 | 1,065 | 1,111 | 1,080 |
Domestic Water Intake Volume (DENSO CORPORATION + Domestic Group Companies)
(Ten thousands of tons)
| Fiscal 2019 | Fiscal 2020 | Fiscal 2021 | |
|---|---|---|---|
| Public water | 869 | 917 | 926 |
| Sewage water | 27 | 30 | 32 |
| Rainwater | 95 | 104 | 35 |
| Total wastewater | 992 | 1,051 | 993 |
* Collection of data on wastewater commenced in fiscal 2019.
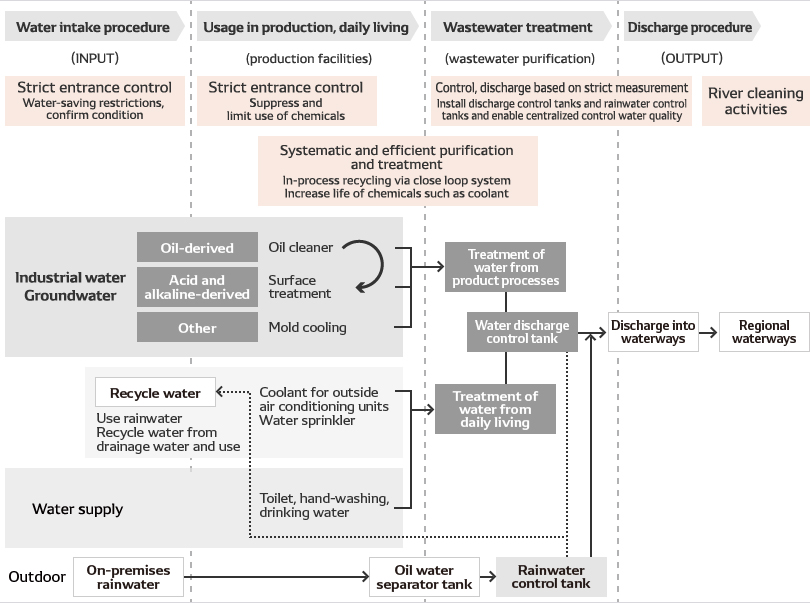
Water Management in Factories
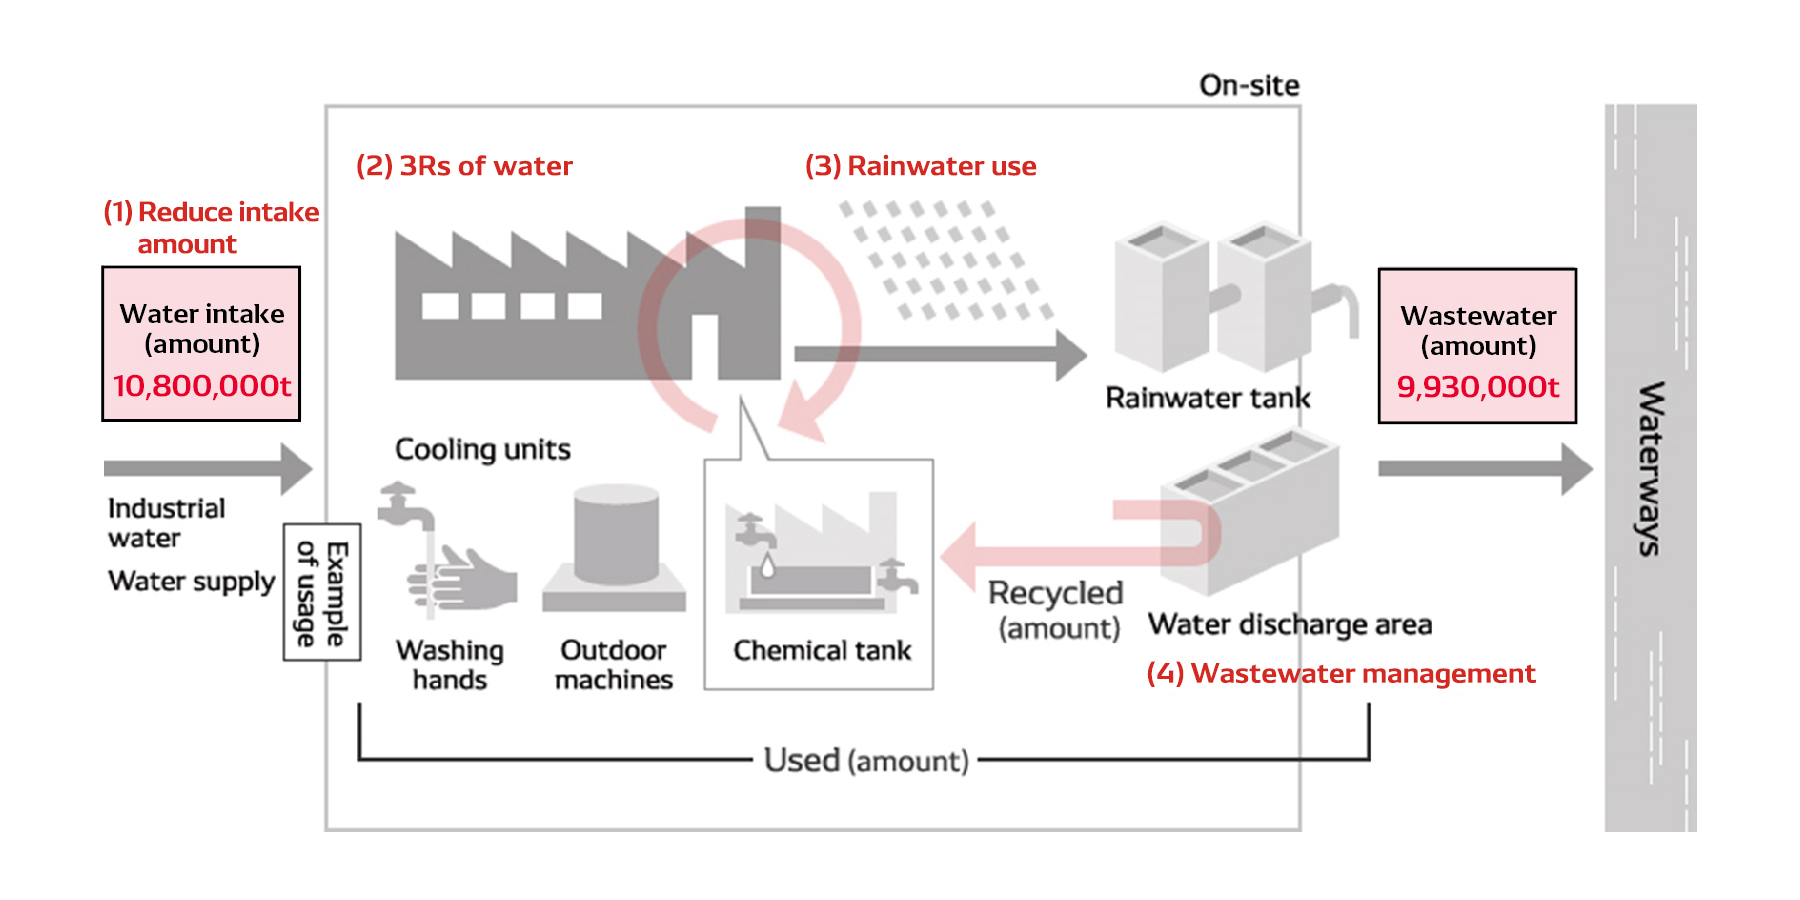
DENSO CORPORATION's water resource management system
Domestic Water Quality (Content When Standard for Wastewater Set at 100) (DENSO CORPORATION)
| Fiscal 2019 | Fiscal 2020 | Fiscal 2021 | ||
|---|---|---|---|---|
| PH | Highest | 93.0 | 93.0 | 94.2 |
| Lowest | 10.3 | 3.4 | 5.2 | |
| Average | 51.8 | 51.3 | 51.8 | |
| COD | Highest | 32.0 | 37.6 | 36.8 |
| Lowest | 8.4 | 8.4 | 6.8 | |
| Average | 20.5 | 20.1 | 19.5 | |
| BOD | Highest | 16.8 | 20.4 | 26.0 |
| Lowest | 2.0 | 0.8 | 0.8 | |
| Average | 4.9 | 4.3 | 5.5 | |
| SS | Highest | 16.7 | 21.0 | 23.3 |
| Lowest | 0.0 | 0.0 | 0.0 | |
| Average | 4.4 | 4.3 | 4.5 | |
| Oil content | Highest | 50.0 | 50.0 | 50.0 |
| Lowest | 0.0 | 0.0 | 0.0 | |
| Average | 17.0 | 17.0 | 17.0 | |
| Total nitrogen | Highest | 23.5 | 24.0 | 19.9 |
| Lowest | 0.0 | 0.0 | 0.0 | |
| Average | 9.7 | 9.9 | 9.1 | |
| Total phosphorus | Highest | 20.0 | 21.0 | 21.0 |
| Lowest | 0.1 | 0.1 | 0.1 | |
| Average | 4.0 | 3.3 | 3.3 | |
| Zinc | Highest | 71.5 | 47.5 | 34.5 |
| Lowest | 1.0 | 0.8 | 0.4 | |
| Average | 8.4 | 7.2 | 5.9 | |
| Escherichia coli (E. coli) | Highest | 7.7 | 9.7 | 6.5 |
| Lowest | 0.0 | 0.0 | 0.0 | |
| Average | 0.3 | 0.4 | 0.3 |
(2)Air
Domestic (Content When Standard for Emissions Set at Zero) (DENSO CORPORATION)
| Fiscal 2019 | Fiscal 2020 | Fiscal 2021 | ||
|---|---|---|---|---|
| Soot and dust | Highest | 1.00 | 0.70 | 0.20 |
| Lowest | 0.00 | 0.00 | 0.00 | |
| Average | 0.04 | 0.06 | 0.04 | |
| SOx | Highest | 0.03 | 0.03 | 0.05 |
| Lowest | 0.00 | 0.00 | 0.00 | |
| Average | 0.00 | 0.00 | 0.00 | |
| NOx | Highest | 0.94 | 0.94 | 0.97 |
| Lowest | 0.00 | 0.04 | 0.00 | |
| Average | 0.29 | 0.32 | 0.34 |
Domestic VOCs (DENSO CORPORATION + Domestic Group Companies)
(Tons)
| Fiscal 2019 | Fiscal 2020 | Fiscal 2021 | |
|---|---|---|---|
| Emissions amount | 612 | 638 | 594 |
(3)Other
Domestic Industrial Waste (DENSO CORPORATION + Domestic Group Companies)
(Tons)
| Fiscal 2019 | Fiscal 2020 | Fiscal 2021 | |||
|---|---|---|---|---|---|
| Valuables | Recycling | 107,219 | 157,587 | 144,122 | |
| Waste | Industrial waste | Special control | 2,021 | 2,114 | 2,276 |
| Other | 23,508 | 29,559 | 25,549 | ||
| Landfill waste | 4 | 13 | 9 | ||
| Resource recycling rate (%) | 99.99% | 99.97% | 99.97% | ||
Action 8 <Workplaces Surrounded by Greenery and an Abundance of Nature>
Tree-Planting Efforts in Collaboration with Local Communities [DENSO CORPORATION and the DENSO Group (Japan)]
| Number of times activities were held | Number of participants | Total number of saplings planted |
|---|---|---|
| 57 | 8,796 * Local community members and employees of DENSO CORPORATION and the DENSO Group (Japan) and their families |
22,812 |
Action 10 <Environmental Management>
Domestic Environmental Accidents/Violations (DENSO CORPORATION + Domestic Group Companies)
(Incidents)
| Fiscal 2019 | Fiscal 2020 | Fiscal 2021 | |
|---|---|---|---|
| Environmental accidents | 0 | 0 | 0 |
| Exceeding of standard limits | 0 | 0 | 0 |
In fiscal 2021, DENSO paid no environment-related fines or penalties.
Acquisition of ISO 14001 at Domestic and Overseas Production Companies (DENSO CORPORATION + Domestic and Overseas Group Companies)
Number of companies that had received ISO 14001 certification as of fiscal 2021 year-end: 73