Data compilation FY2023 (Environmental report)
Performance data for our environmental initiatives is divided into 10 categories of action under our Eco Vision 2025.
Changes in data over time are primarily based on the previous five years.
(Exceptions: Items listed that have a period of data collection of less than five years and items that have a specified base year)
Action 2 <Minimum CO2 Monozukuri>
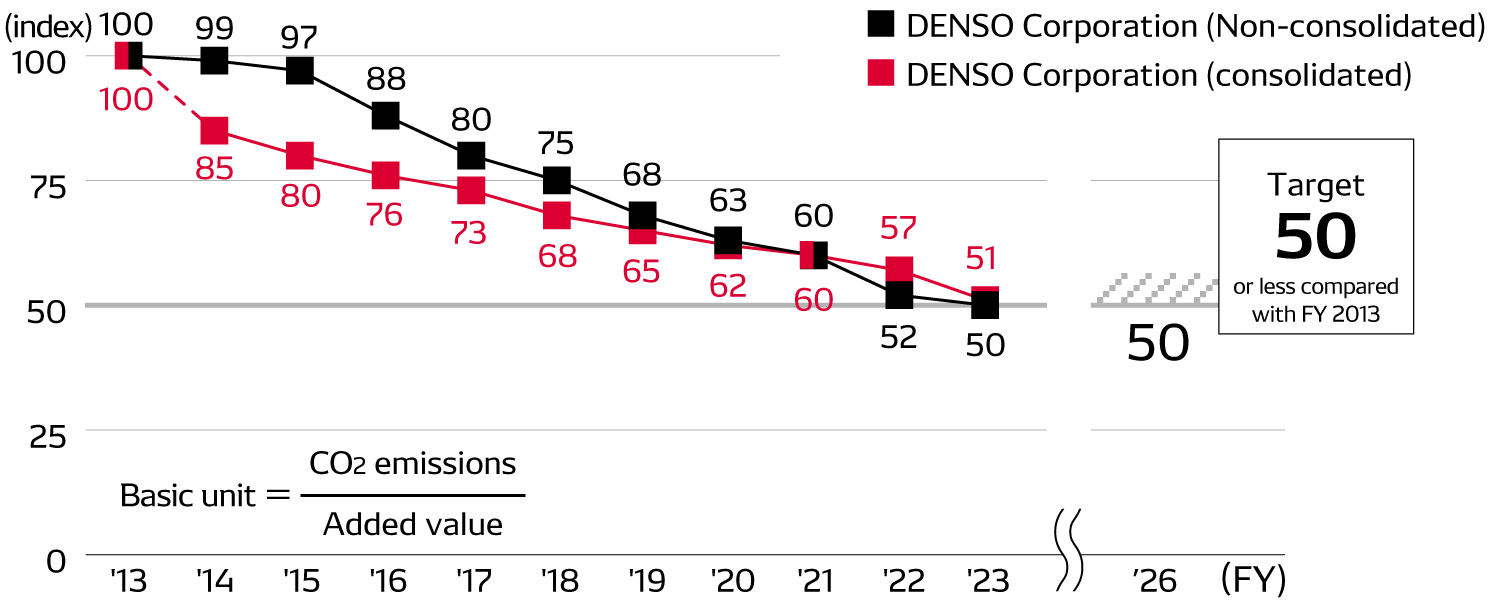
Global CO2 emissions basic unit of the DENSO Group in Scope 1 and Scope 2 [the DENSO Group]
Global Scope 1 and Scope 2 CO2 Emissions and Their Breakdown [the DENSO Group]
(Thousands of t-CO2)
| Fiscal year | 2020 | 2021 | 2022 | 2023 | |
|---|---|---|---|---|---|
| Scope 1 | DENSO CORPORATION | 449 | 379 | 394 | 368 |
| Domestic Group companies | 57 | 49 | 49 | 44 | |
| Overseas Group companies | 205 | 148 | 159 | 154 | |
| Scope 2 | DENSO CORPORATION | 392 | 385 | 277 | 206 |
| Domestic Group companies | 220 | 309 | 307 | 318 | |
| Overseas Group companies | 560 | 722 | 752 | 693 | |
| Total | 1,883 | 1,991 | 1,938 | 1,783 | |
Calculation methods were changed in fiscal 2021
• Scope 1 emissions are calculated based on the GHG Protocol and IPCC guidelines.
• Scope 2 emissions are calculated based on market standards.
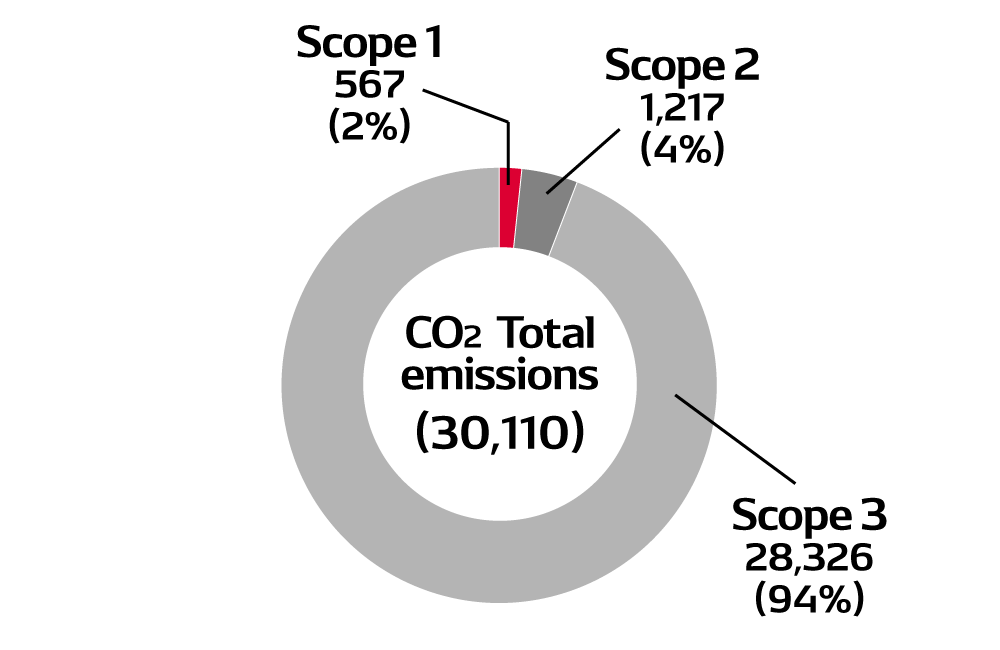
Proportion of total CO2 emissions throughout value chain
The proportions expressed in the graph are based on the international guideline "GHG Protocol Scope 3 Standard" related to the calculation and reporting of CO2 emissions throughout the value chain.
* Of the "scopes" (scope of emissions) for greenhouse gases: (a) Scope 1 emissions are direct GHG emissions from the entity such as gasoline or the combustion of heavy oil; (b) Scope 2 emissions are indirect GHG emissions resulting from the generation of electricity; and (c) Scope 3 emissions include indirect GHG emissions from related activities undertaken outside of the entity such as raw material procurement, production, disposal, logistics, and sales.
Global CO2 Emissions of the DENSO Group (Fiscal 2023) [the DENSO Group] (Thousands of t-CO2)
Global Trends in CO2 emissions (Scope 1, Scope 2, and Scope 3) [the DENSO Group]
(Thousands of t-CO2)
| Fiscal year | 2020 | 2021 | 2022 | 2023 |
|---|---|---|---|---|
| DENSO CORPORATION | 841 | 764 | 671 | 574 |
| Domestic Group companies | 277 | 358 | 356 | 362 |
| Overseas Group companies | 766 | 870 | 910 | 847 |
| Total (Scope 1 and Scope 2) | 1,883 | 1,991 | 1,937 | 1,784 |
| Scope 3 | 19,031 | 27,732 | 27,790 | 28,326 |
| Total (Scope 1, Scope 2, and Scope 3) | 20,914 | 29,723 | 29,727 | 30,110 |
The calculations methods for Scope 1, Scope 2, and Scope 3 emissions were changed in fiscal 2021.
Breakdown of Global Scope 3 CO2 Emissions (Fiscal 2023) [the DENSO Group]
| Scope 3 category | Emissions amount (Thousands of tons) |
Notes | ||
|---|---|---|---|---|
| Fiscal 2021 | Fiscal 2022 | Fiscal 2023 | ||
| 1. Purchased goods and services | 9,487 | 10,642 | 9,930 | |
| 2. Capital goods | 1,288 | 1,217 | 1,262 | |
| 3. Fuel- and energy-related activities (excluding Scope 1 and Scope 2) |
233 | 239 | 359 | |
| 4. Transportation and distribution (upstream) |
65 | 77 | 1,351 | |
| 5. Waste generated from operations | 38 | 40 | 27 | |
| 6. Business travel | 22 | 22 | 21 | |
| 7. Employee commuting | 80 | 81 | 80 | |
| 8. Leased assets (upstream) | 0 | 0 | 0 | Recorded in Scope 2 |
| 9. Transportation and distribution (downstream) |
0 | 0 | 0 | Recorded in 4. Transportation and distribution (upstream) |
| 10. Processing of sold products | 17 | 21 | 25 | |
| 11. Use of sold products | 16,366 | 15,285 | 15,093 | |
| 12. End-of-life treatment of sold products | 33 | 36 | 42 | |
| 13. Leased assets (downstream) | 0 | 0 | 0 | No relevant businesses |
| 14. Franchises | 0 | 0 | 0 | No relevant businesses |
| 15. Investments | 105 | 0 | 136 | |
| 16. Other (upstream and downstream) |
0 | 0 | 0 | No relevant businesses |
| Scope 3 total | 27,732 | 27,790 | 28,326 | |
Global Greenhouse Gas Emissions [the DENSO Group]
(Thousands of t-CO2e)
| Fiscal year | 2020 | 2021 | 2022 | 2023 |
|---|---|---|---|---|
| CO2 | 947 | 575 | 602 | 567 |
| CH4 | 12 | 3 | 4 | 2 |
| N2O | 3 | 12 | 13 | 8 |
| HFCs | 2 | 8 | 10 | 7 |
| PFCs | 49 | 51 | 58 | 86 |
| SF6 | 11 | 10 | 11 | 13 |
| Others | 0 | 0 | 0 | 0 |
Calculation methods were changed in fiscal 2021.
Global Volume of Energy Used [the DENSO Group]
(GJ)
| Fiscal year | 2020 | 2021 | 2022 | 2023 |
|---|---|---|---|---|
| Scope 1 | 9,622,392 | 11,969,344 | 12,563,054 | 11,757,397 |
| Scope 2 | 9,189,391 | 11,133,856 | 11,502,973 | 11,545,673 |
| Total | 18,811,784 | 23,105,220 | 24,066,027 | 23,303,070 |
< Scope of Data Collection >
Fiscal 2020: DENSO CORPORATION + Domestic Group companies (Japan)
Fiscal 2021 onward: The DENSO Group (Global)
CO2 emissions from logistics [DENSO CORPORATION]
| Fiscal year | 2013 (Base year) |
・・・ | 2018 | 2019 | 2020 | 2021 | 2022 | 2023 |
|---|---|---|---|---|---|---|---|---|
| 1,000t-CO2 | 34.4 | 34.3 | 41.8 | 43.2 | 40.4 | 45.5 | 50.4 |
Calculation methods were changed in fiscal 2023.
Amount of CO2 emissions in logistics / Physical production and sales (Unit: 100 million yen) [DENSO Corporation]
We are working to reduce CO2 emissions from our logistics operations through the enhancement of vehicle load rates, the shortening of transportation distance, and other measures aimed at improving these operations.
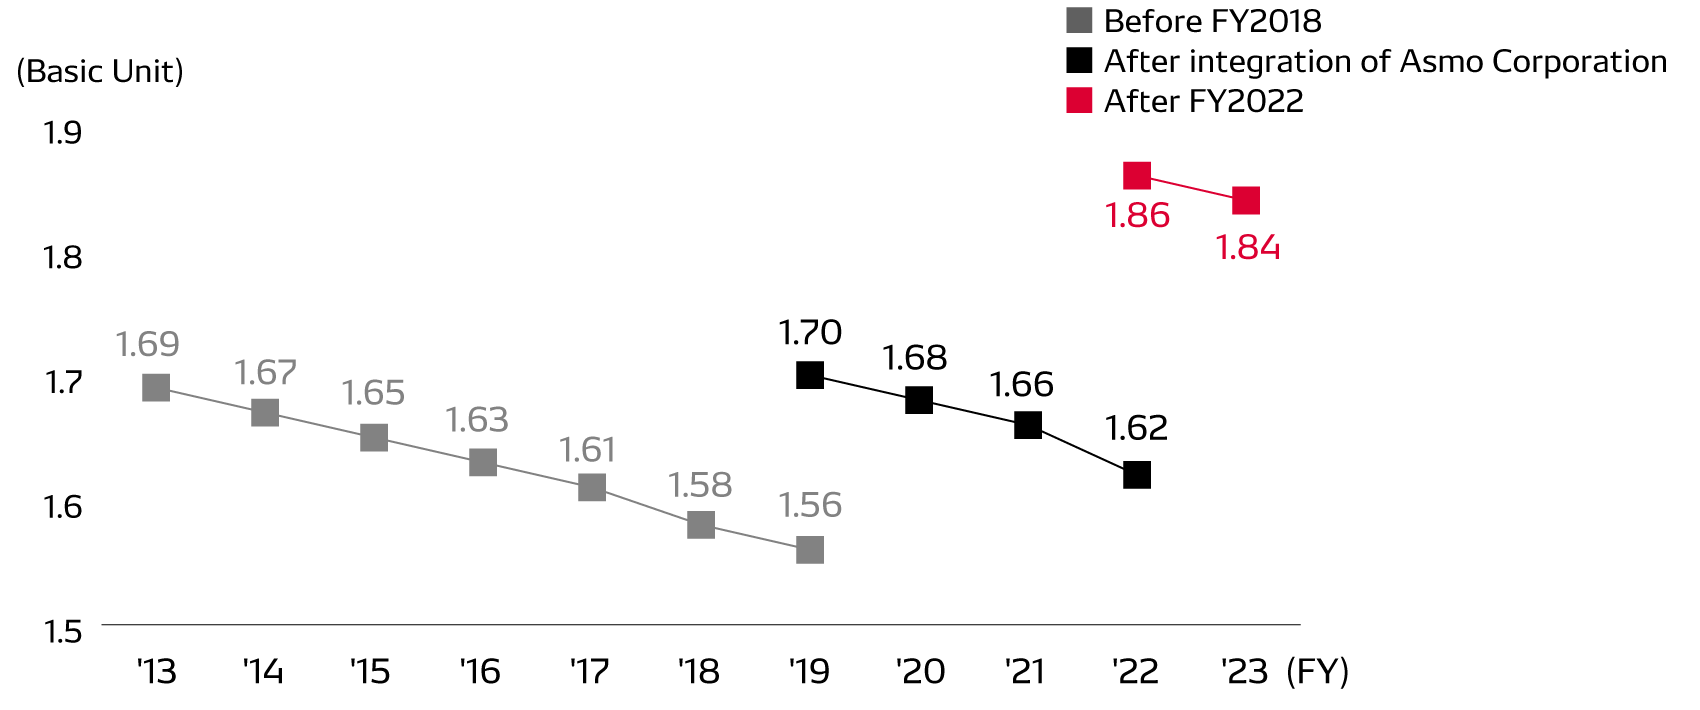
*Asmo Corporation was integrated into Denso Corporation (April 2018).
*In fiscal 2023, we increased the accuracy of this data by visualizing and reflecting transportation performance, which previously could not be reflected in the data as it was outside the scope of DENSO CORPORATION’s standard system management.
Action 4 <Eco-Materials & Low-Emissions>
Product reconditioning volumes at DENSO REMANI [Japan]
-
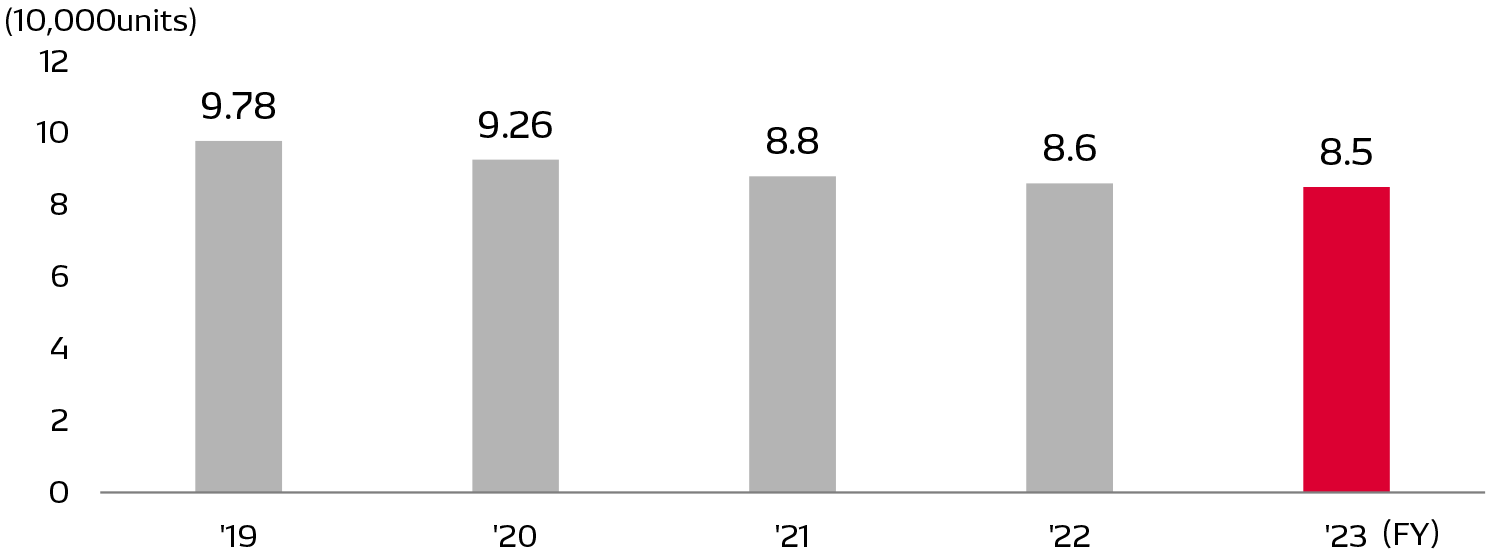
Note: We reduced the number of products that require reconditioning through such efforts as extending the life span of alternators.
Action 5 <Minimum Environmental Impact Production>
(1)Water
Global Water Intake (Usage) Volume [the DENSO Group]
(Ten thousands of tons)
| Fiscal year | 2018 | 2019 | 2020 | 2021 | 2022 | 2023 |
|---|---|---|---|---|---|---|
| Water Intake Volume | 1,204 | 1,065 | 1,111 | 1,427 | 1,580 | 1,508 |
Global Wastewater Volume [the DENSO Group]
(Ten thousands of tons)
| Fiscal year | 2019 | 2020 | 2021 | 2022 | 2023 |
|---|---|---|---|---|---|
| Public water | 869 | 917 | 935 | 943 | 910 |
| Sewage water | 27 | 30 | 216 | 360 | 271 |
| Other | 95 | 104 | 8 | 14 | 16 |
| Total wastewater | 992 | 1,051 | 1,159 | 1,317 | 1,197 |
* Collection of data on wastewater commenced in fiscal 2019.
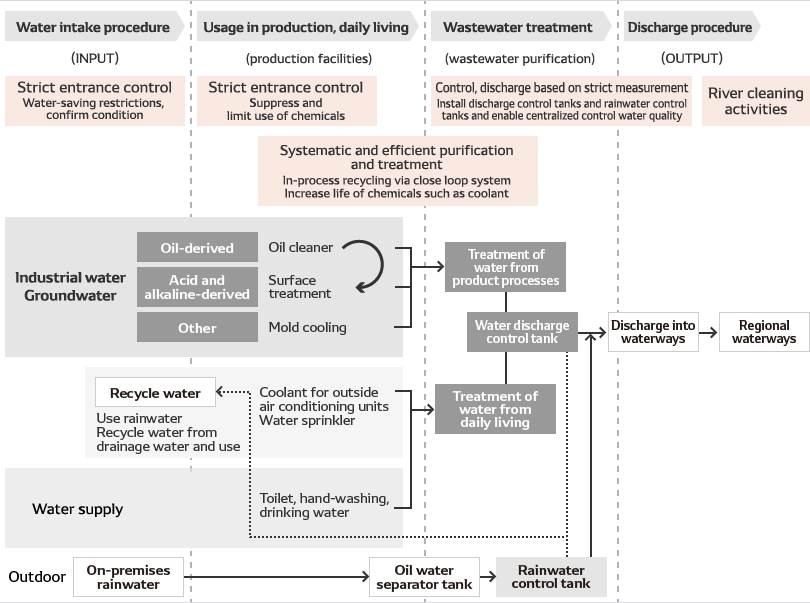
Water Management in Factories
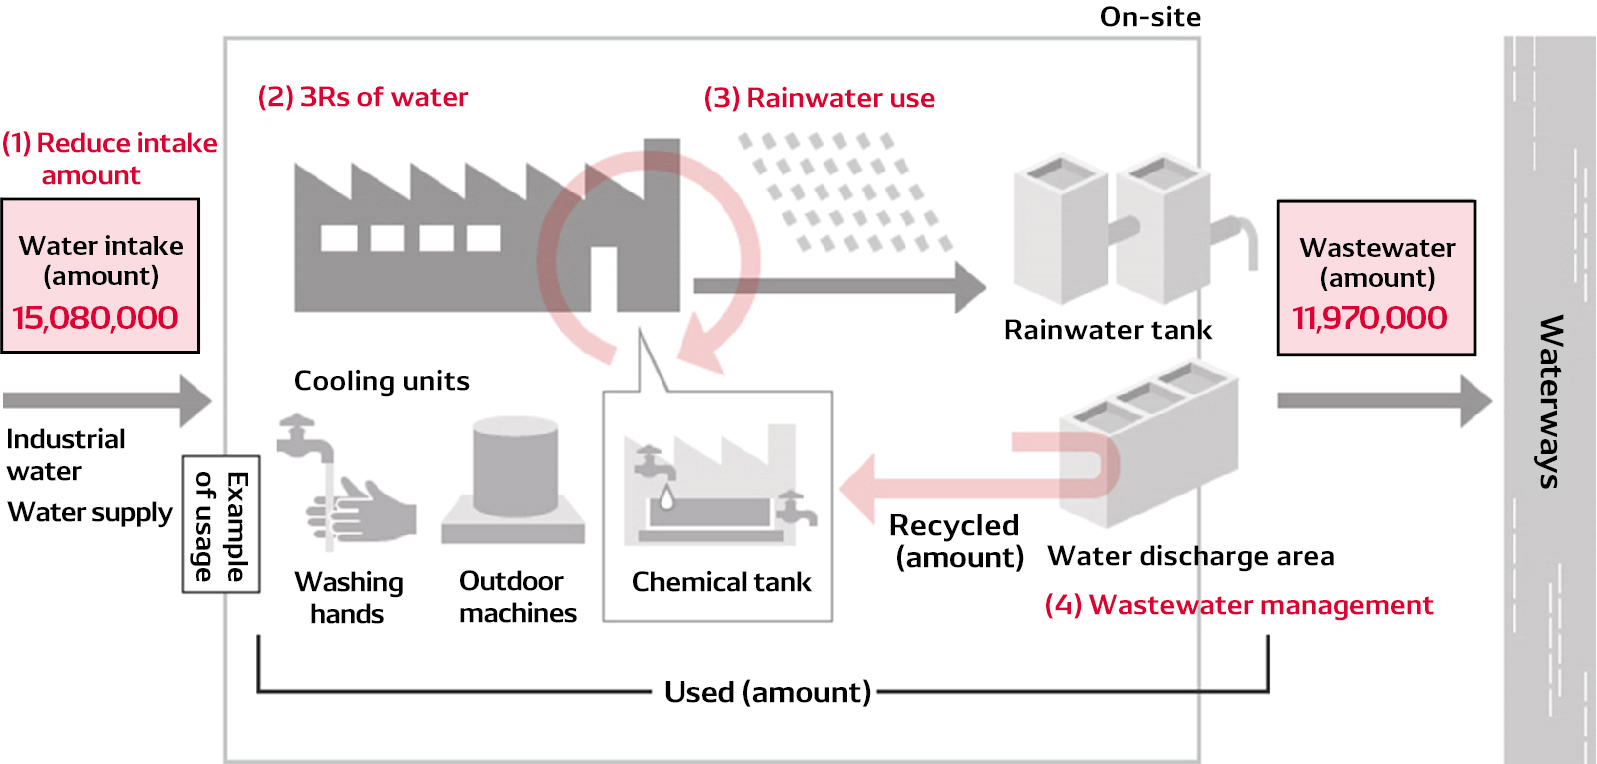
DENSO CORPORATION's water resource management system
Water Quality (Contents When Regulatory Value Is Set at 100) at 14 Facilities of DENSO CORPORATION [DENSO CORPORATION]
| Fiscal year | 2019 | 2020 | 2021 | 2022 | 2023 | |
|---|---|---|---|---|---|---|
| PH | Highest | 93.0 | 93.0 | 94.2 | 76.0 | 79.3 |
| Lowest | 10.3 | 3.4 | 5.2 | 3.7 | 0.0 | |
| Average | 51.8 | 51.3 | 51.8 | 23.9 | 22.94 | |
| COD | Highest | 32.0 | 37.6 | 36.8 | 32.8 | 34.4 |
| Lowest | 8.4 | 8.4 | 6.8 | 8.4 | 8.4 | |
| Average | 20.5 | 20.1 | 19.5 | 20.6 | 19.6 | |
| BOD | Highest | 16.8 | 20.4 | 26.0 | 42.8 | 14.0 |
| Lowest | 2.0 | 0.8 | 0.8 | 0.0 | 0.0 | |
| Average | 4.9 | 4.3 | 5.5 | 4.3 | 4.2 | |
| SS | Highest | 16.7 | 21.0 | 23.3 | 50.0 | 22.3 |
| Lowest | 0.0 | 0.0 | 0.0 | 0.0 | 0.0 | |
| Average | 4.4 | 4.3 | 4.5 | 4.8 | 4.7 | |
| Oil content | Highest | 50.0 | 50.0 | 50.0 | 50.0 | 50.0 |
| Lowest | 0.0 | 0.0 | 0.0 | 0.0 | 0.0 | |
| Average | 17.0 | 17.0 | 17.0 | 28.3 | 28.3 | |
| Total nitrogen | Highest | 23.5 | 24.0 | 19.9 | 19.8 | 19.9 |
| Lowest | 0.0 | 0.0 | 0.0 | 0.3 | 0.6 | |
| Average | 9.7 | 9.9 | 9.1 | 8.7 | 8.4 | |
| Total phosphorus | Highest | 20.0 | 21.0 | 21.0 | 15.4 | 19.0 |
| Lowest | 0.1 | 0.1 | 0.1 | 0.1 | 0.1 | |
| Average | 4.0 | 3.3 | 3.3 | 3.4 | 3.5 | |
| Zinc | Highest | 71.5 | 47.5 | 34.5 | 26.5 | 30.5 |
| Lowest | 1.0 | 0.8 | 0.4 | 0.4 | 0.2 | |
| Average | 8.4 | 7.2 | 5.9 | 5.7 | 6.5 | |
| Escherichia coli (E. coli) | Highest | 7.7 | 9.7 | 6.5 | 38.7 | 48.0 |
| Lowest | 0.0 | 0.0 | 0.0 | 0.0 | 0.0 | |
| Average | 0.3 | 0.4 | 0.3 | 0.5 | 0.7 | |
Note: Calculation methods were changed in fiscal 2022.
(2)Air
Air Pollutants (Contents When Standard for Emissions Is Set at 100) at 12 Facilities of DENSO CORPORATION [DENSO CORPORATION]
| Fiscal year | 2019 | 2020 | 2021 | 2022 | 2023 | |
|---|---|---|---|---|---|---|
| Soot and dust | Highest | 100 | 70 | 20 | 100 | 100 |
| Lowest | 0 | 0 | 0 | 0 | 0 | |
| Average | 4 | 6 | 4 | 5.4 | 5.3 | |
| SOx | Highest | 0 | 3 | 5 | 4.6 | 2 |
| Lowest | 0 | 0 | 0 | 0 | 0 | |
| Average | 0 | 0 | 0 | 0.1 | 0.5 | |
| NOx | Highest | 94 | 94 | 97 | 97 | 94 |
| Lowest | 0 | 4 | 0 | 0 | 0 | |
| Average | 29 | 32 | 34 | 30.4 | 28 | |
Domestic VOCs [DENSO CORPORATION + Domestic Group Companies] 27 Companies
(Tons)
| Fiscal year | 2019 | 2020 | 2021 | 2022 | 2023 |
|---|---|---|---|---|---|
| Emissions amount | 612 | 638 | 594 | 714 | 632 |
Status of Domestic Efforts to Reduce VOCs [DENSO CORPORATION]
In fiscal 2023, VOC emissions decreased from the previous fiscal year through a reduction in the use of raw materials, despite a temporary increase in fiscal 2022 (from fiscal 2021) due to a recovery in production volume.
-
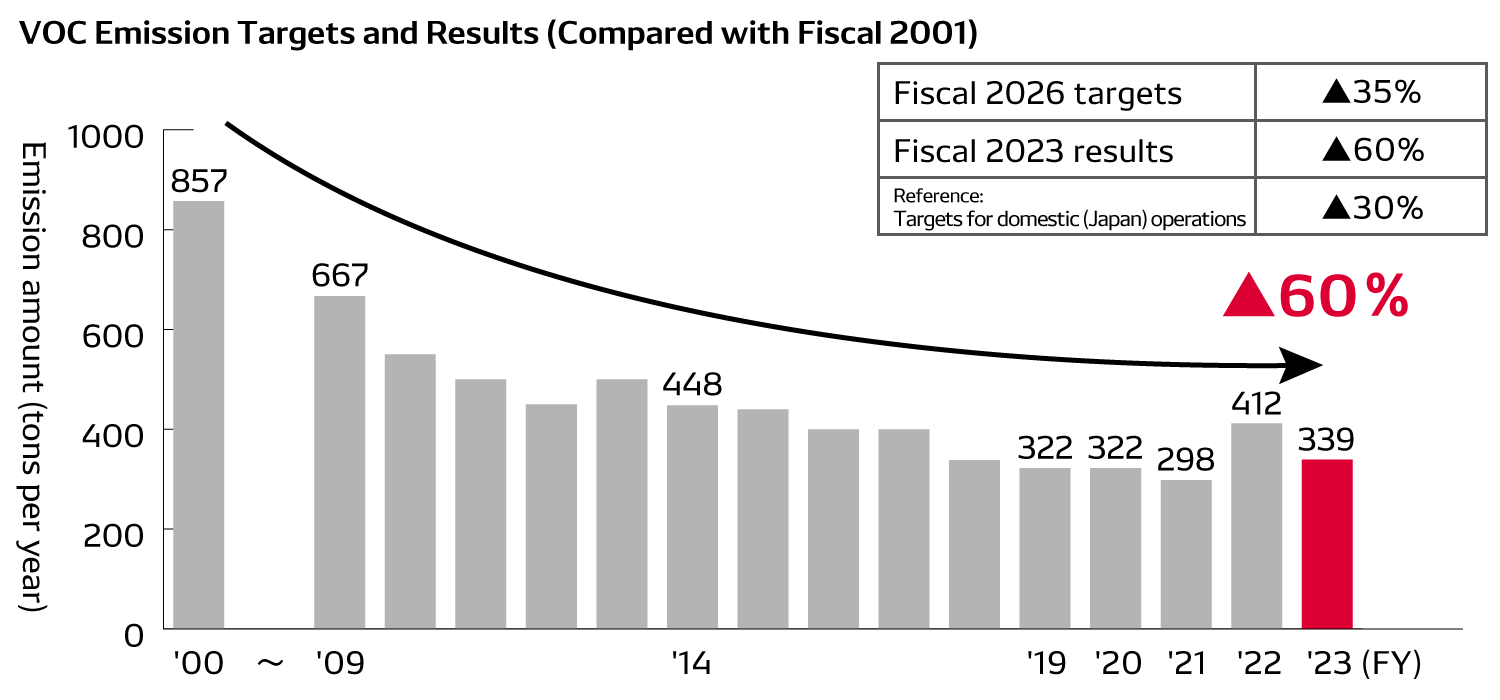
The results achieved in fiscal 2022 have already reached our fiscal 2026 target under the DENSO Eco Vision 2025.
(3) Emissions and Industrial Waste
Domestic Industrial Waste [DENSO CORPORATION + Domestic Group Companies] 27 Companies
| Details | Unit | 2018 | 2019 | 2020 | 2021 | 2022 | ||
|---|---|---|---|---|---|---|---|---|
| ① Total emissions (②+③) | t | 132,748 | 189,260 | 171,947 | 158,785 | 155,051 | ||
| ② Valuables (sale of scrap metal, etc.) | t | 107,219 | 157,587 | 144,122 | 131,210 | 124,285 | ||
| ③ Industrial waste (④+⑤=⑥+⑦) | t | 25,529 | 31,673 | 27,825 | 27,575 | 30,766 | ||
| Breakdown of industrial waste | By type | ④ Special control hazardous waste | t | 2,021 | 2,114 | 2,276 | 2,350 | 2,546 |
| ⑤ Other | t | 23,508 | 29,559 | 25,549 | 25,225 | 28,220 | ||
| By processing method | ⑥ Recycling | t | 25,525 | 31,660 | 27,816 | 27,556 | 30,756 | |
| ⑦ Landfill waste | t | 4 | 13 | 9 | 19 | 10 | ||
| ⑧ Resource recycling rate (⑥/(⑥+⑦)×100) |
% | 99.99% | 99.96% | 99.97% | 99.93% | 99.97% | ||
Total Emissions and Plastic Waste Volumes (DENSO CORPORATION)
-
Total Emissions and Plastic Waste Volumes
(DENSO CORPORATION)Achievement of company target in fiscal 2019
-
-
Recycling Rate of Plastic Waste
(DENSO CORPORATION)Ongoing maintenance of 100% target
-


Action 8 <Workplaces Surrounded by Greenery and an Abundance of Nature>
Tree-Planting Efforts in Collaboration with Local Communities [DENSO CORPORATION and the DENSO Group (Japan)]
| Number of times activities were held | 60 |
|---|---|
| Number of participants |
9,117 * Local community members and employees of DENSO CORPORATION and the DENSO Group (Japan) and their families |
| Total number of saplings planted | 22,812 |
Action 10 <Environmental Management>
Domestic Environmental Accidents/Violations, Environment-Related Fines and Penalties [DENSO CORPORATION + Domestic Group Companies]
(Incidents)
| Fiscal year | 2019 | 2020 | 2021 | 2022 | 2023 |
|---|---|---|---|---|---|
| Environmental accidents | 0 | 0 | 0 | 0 | 0 |
| Exceeding of standard limits | 0 | 0 | 0 | 0 | 0 |
During fiscal 2023, DENSO did not pay any environment-related fines or penalties.
Acquisition of ISO 14001 at Global Production Companies [DENSO CORPORATION + Domestic and Overseas Group Companies]
-
Number of companies that had received ISO 14001 certification as of fiscal 2023 year-end
69 -
Acquisition rate
Out of 70 DENSO environmental control centers,* 98.6% have received ISO 14001 certification
(The one company that has not received this certification has received an alternative system certification.)
* Environmental management center: DENSO CORPORATION plants and production companies among the domestic and overseas Group companies of which DENSO owns a stake of 50% or higher