Data compilation FY2022 (Social report)
Collection of Performance Data Related to Our Social Initiatives
Changes in data over time are primarily based on the previous five years.
(Items for which the period of data collection has been less than five years are listed based on the period in which data collection was possible.)
- Together with Our Customers
- Together with Our Suppliers
- Together with Local Communities
- Together with Our Employees
(Communication Based on Mutual Trust and Responsibility) - Together with Our Employees
(Human Resource Development) - Together with Our Employees
(Respect for Human Rights) - Together with Our Employees
(Encouraging Diversity and
Promoting a Work-Life Balance) - Together with Our Employees
(Safety and Health) - Together with Our Employees
(Promoting Employee Health)
Together with Our Customers
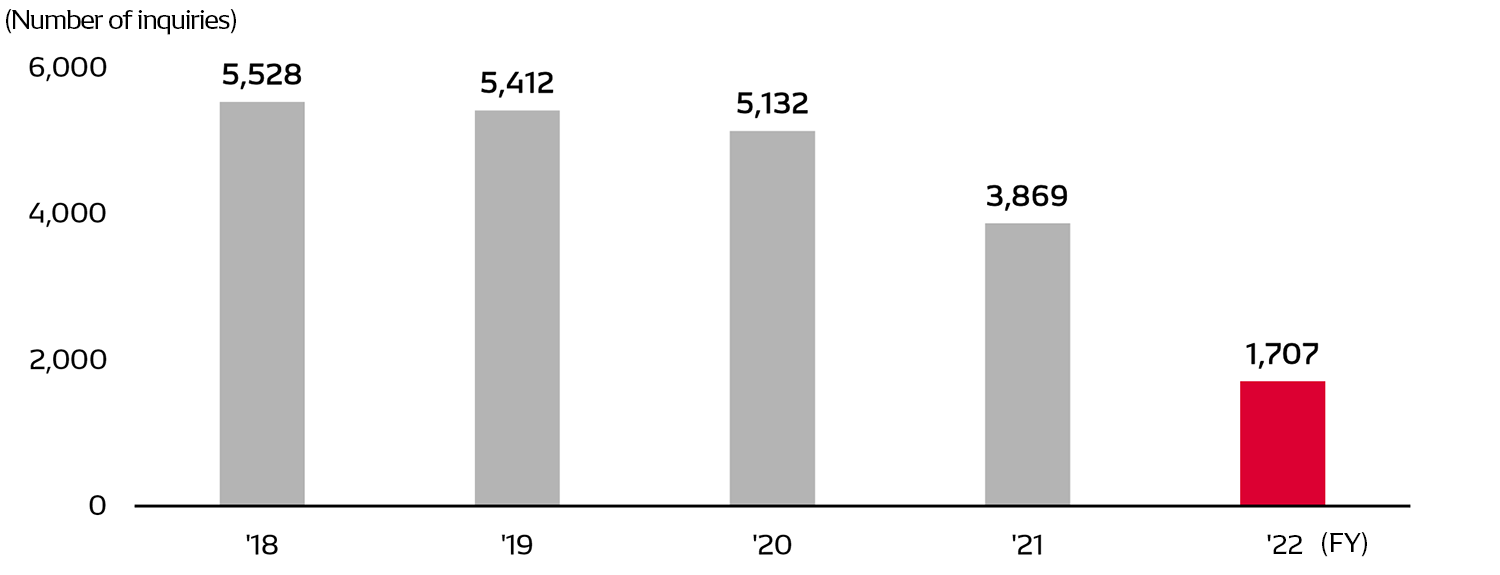
Inquiries and comments regarding DENSO products [Japan]
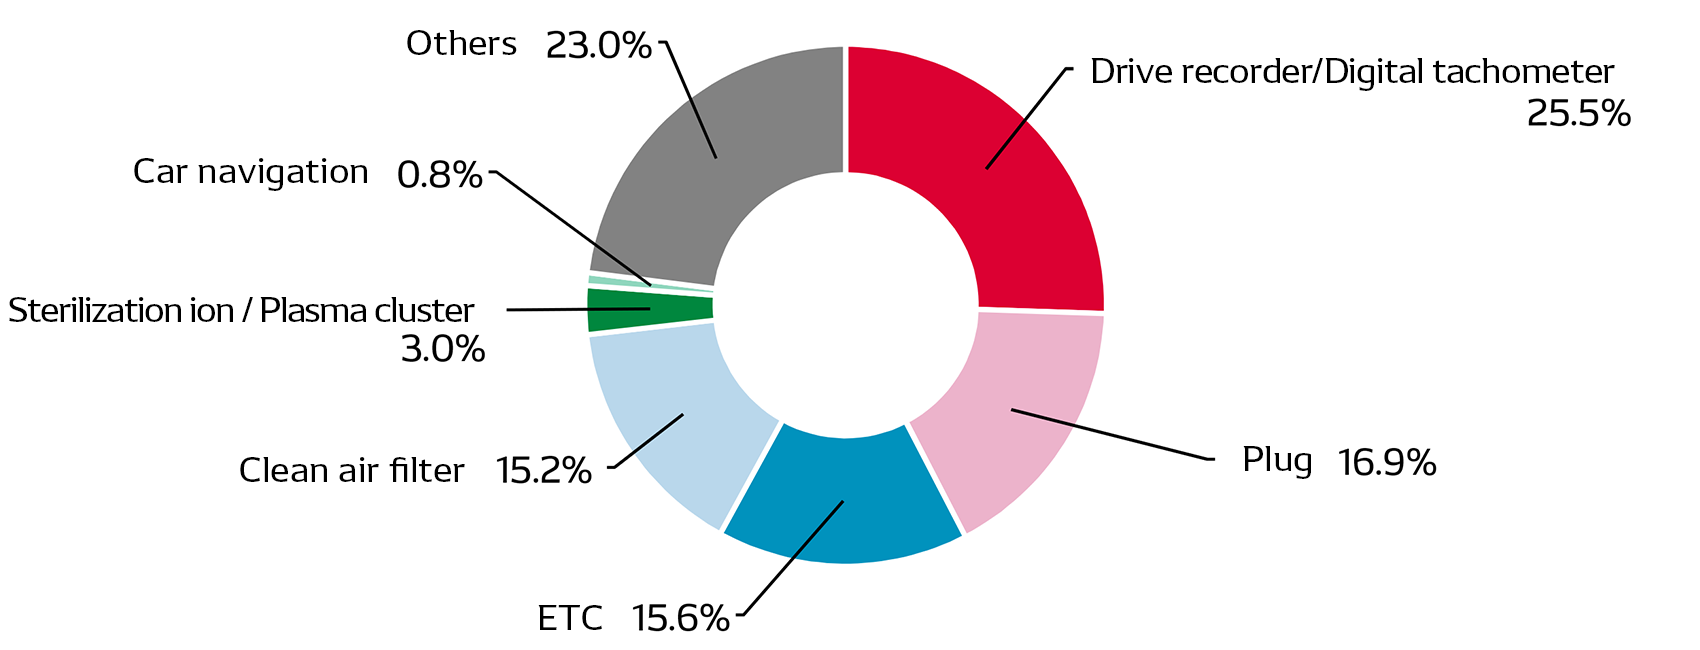
We have carried out a renewal of our corporate webpage so that the customers who use our products can receive answers to their questions in an accurate and consistent manner and at a time that best suits them. As a result, the ratio of customers being able to resolve issues on their own has increased significantly, and the total number of customer inquiries in fiscal 2022 decreased compared with the previous fiscal year.
Breakdown of Inquiries by Product in Fiscal 2022
Number of service stations (as of March 2022)[global]
| Japan | 685 |
Designated service stations: 144 Dealerships: 441 Others: 100 |
|---|---|---|
| Overseas | 2,391 (108 countries) |
Central distributors: 146 Service dealers: 2,245 |
Number of service counters (as of March 2022) [global]
| Japan | North America | Central and South America | Europe | China | Asia | Oceania | Middle East and Africa |
|---|---|---|---|---|---|---|---|
| 1,986 | 328 | 197 | 405 | 330 | 1,141 | 101 | 180 |
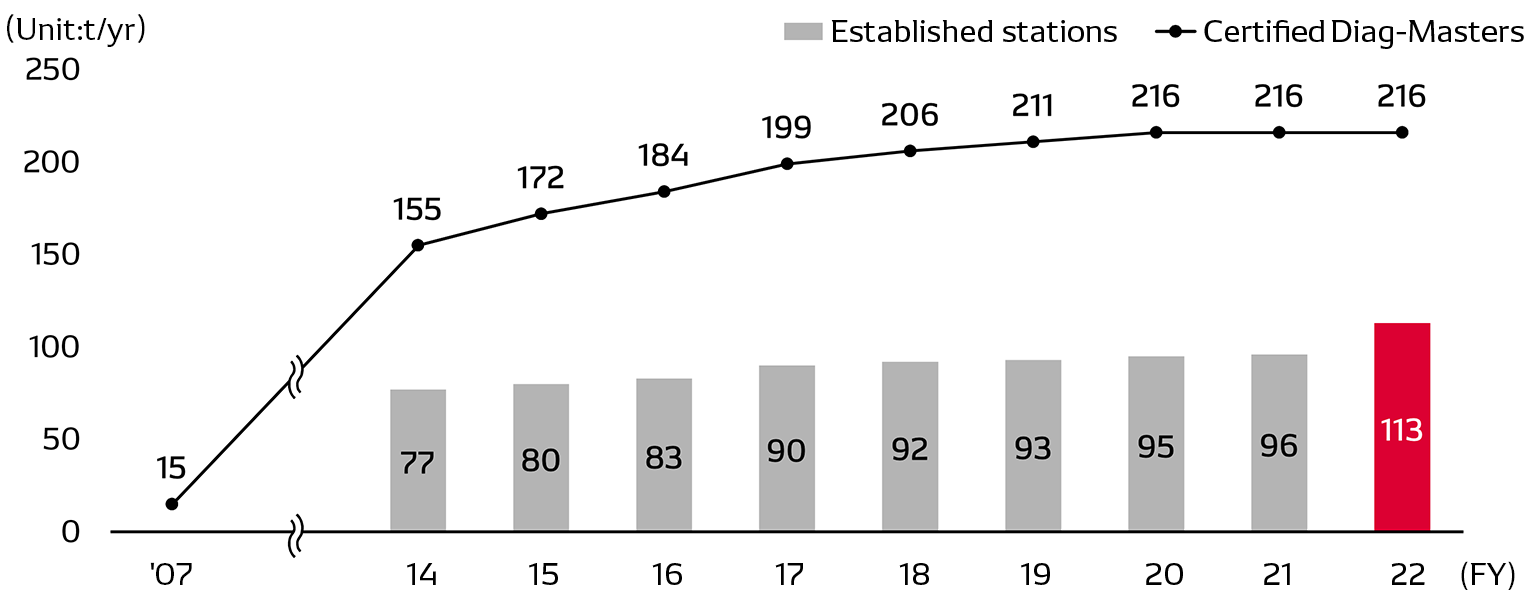
Number of Established Diag-Stations* and Number of Certified Diag-Masters* [Japan]
* Diag-Stations: Service stations equipped with the facilities, personnel, and information needed to provide a swift failure diagnosis of vehicles equipped with advanced technologies.
* Diag-Masters: Specialists who have received relevant training on failure diagnosis of advanced system products, which DENSO implements, and have passed a certification examination.
Together with Our Suppliers
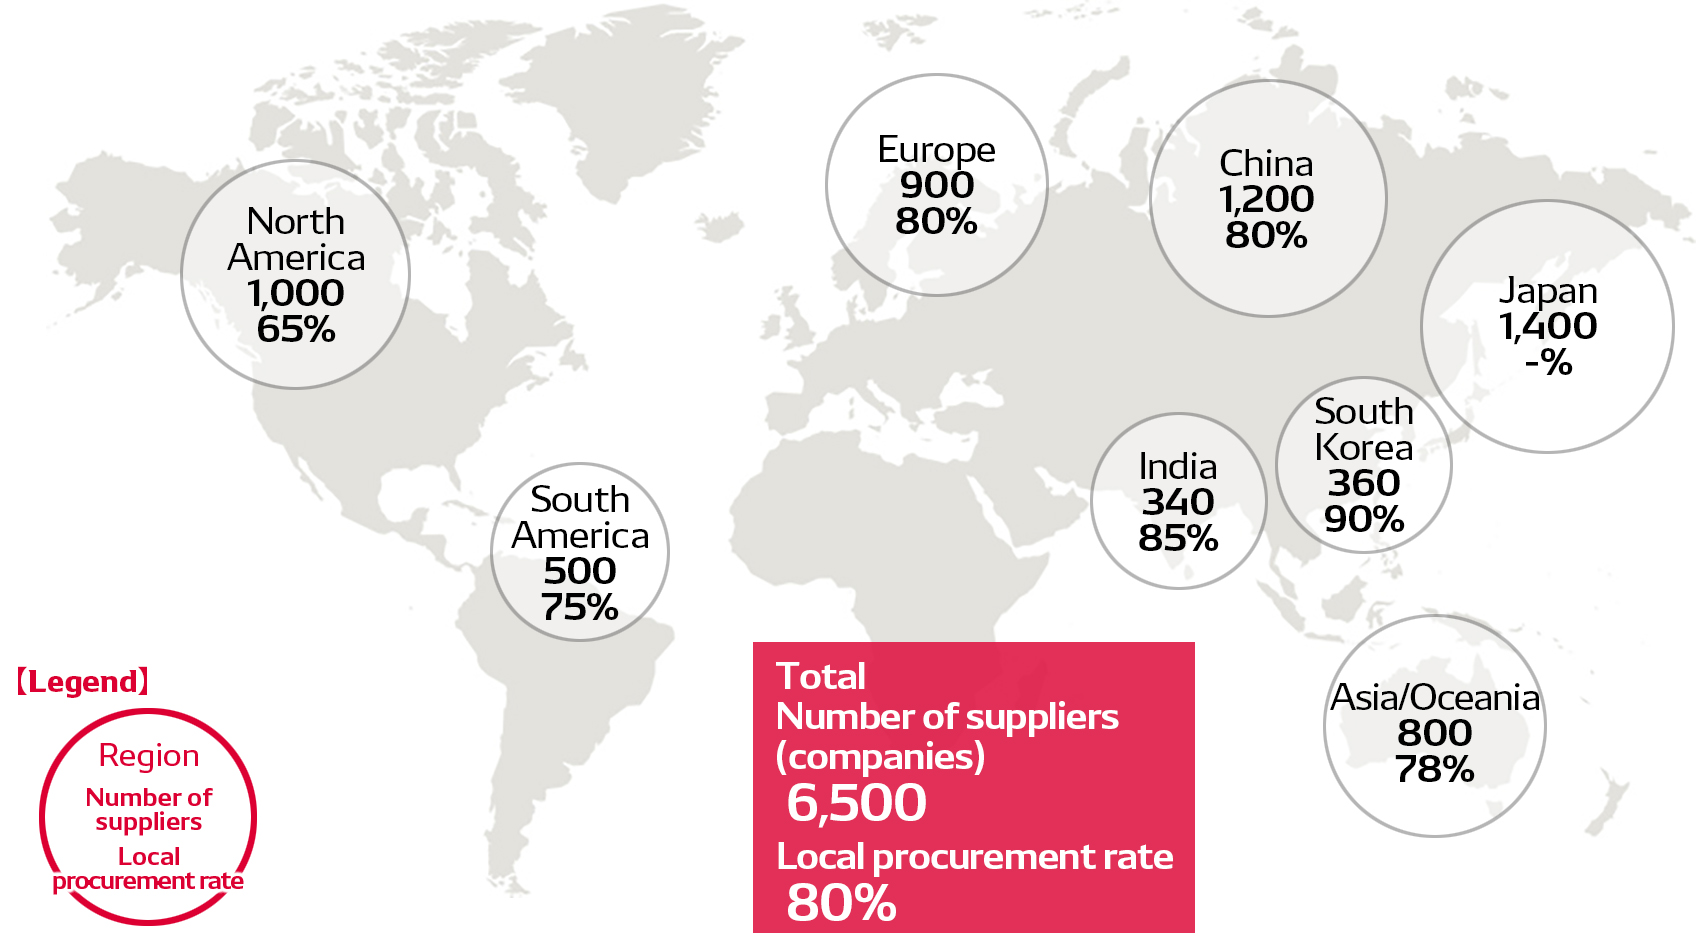
Number of Regional Suppliers/Local Procurement Rate (as of March 2021) [Global]
Status of implementation of Sustainability self-check [global] ※Conducted every other year
Execution rate: 100% (Note: Requested participation of roughly 1,900 main foreign and domestic suppliers)
Status of implementation of survey on conflict minerals [global]
Survey response rate: 100% (roughly 5,000 foreign and domestic suppliers)
Together with Local Communities
Status of the DENSO Group's social contribution activities (fiscal 2022) [global]
Breakdown of results of social contribution activities [DENSO Corporation]
(millions of yen)
| Breakdown of activity expenses | Fiscal 2018 | Fiscal 2019 | Fiscal 2020 | Fiscal 2021 | Fiscal 2022 |
|---|---|---|---|---|---|
| Welfare | 79 | 120 | 137 | 35 | 42 |
| 6.03% | 8.65% | 11.15% | 5.10% | 7.32% | |
| Youth development | 159 | 170 | 122 | 70 | 70 |
| 12.05% | 12.22% | 9.95% | 10.18% | 12.06% | |
| Environmental consciousness | 48 | 57 | 52 | 24 | 35 |
| 3.68% | 4.10% | 4.23% | 3.46% | 6.10% | |
| Culture and art | 151 | 418 | 375 | 196 | 79 |
| 11.44% | 30.04% | 30.56% | 28.34% | 13.62% | |
| Local communities and others | 880 | 625 | 541 | 366 | 353 |
| 66.80% | 44.99% | 44.11% | 52.92% | 60.91% | |
| Total | 1,316 | 1,390 | 1,227 | 692 | 580 |
Status of participation in activities [DENSO CORPORATION]
| Program name | Fiscal 2018 | Fiscal 2019 | Fiscal 2020 | Fiscal 2021 | Fiscal 2022 |
|---|---|---|---|---|---|
| Participants in HEARTFUL Festival | 4,677 | 5,174 | 2,809 |
Total number of online views*1 9,090 Number of channel subscribers 144 |
Total number of online views*1 5,228 Number of channel subscribers 193 |
| Number of subscribers to “Smile You Net” website | 3,492 | 3,500 | 3,517 | 3,532 | 3,534 |
| Members of HEARTFUL Fund | 7,957 | 7,909 | 7,790 | 7,268 | 7,011 |
*1 Held online in order to prevent the spread of COVID-19
Support from Special Fund [DENSO Corporation]
| Details of support | Fiscal 2018 | Fiscal 2019 | Fiscal 2020 | Fiscal 2021 | Fiscal 2022 |
|---|---|---|---|---|---|
| Donations to NPOs and others | 35 cases | 34 cases | 21 cases | 130 cases | 140 cases |
| 12.96 million yen | 19.12 million yen | 11.65 million yen | 19.08 million yen | 19.06 million yen | |
| Natural disaster relief money | 1 cases | 2 cases | 1 cases | 1 cases | 1 cases |
| 0.2 million yen | 0.6 million yen | 0.5 million yen | 0.5 million yen | 1.30 million yen | |
| Support to areas affected by the Great East Japan Earthquake | 14 cases | 13 cases | 13 cases | 23 cases | 12 cases |
| 20.00 million yen | 15.50 million yen | 11.00 million yen | 11.30 million yen | 8.30 million yen |
Together with Our Employees
Communication Based on Mutual Trust and Responsibility
Number of Associates by Region [DENSO Group]
| Fiscal year | 2018 | 2019 | 2020 | 2021 | 2022 |
|---|---|---|---|---|---|
| Japan | 68,136 | 76,770 | 77,589 | 75,068 | 74,677 |
| Asia/Oceania | 43,455 | 50,099 | 49,139 | 39,803 | 40,319 |
| North America | 21,852 | 25,126 | 25,117 | 20,634 | 21,328 |
| Europe | 14,905 | 16,688 | 16,254 | 13,122 | 12,700 |
| Other regions | 3,311 | 3,309 | 2,833 | 2,832 | 2,835 |
| Total | 151,659 | 171,992 | 170,932 | 151,459 | 151,859 |
Status of hiring (employee composition) [DENSO Corporation]
| Fiscal year | 2018 | 2019 | 2020 | 2021 | 2022 | ||||||
|---|---|---|---|---|---|---|---|---|---|---|---|
| Full time | 40,667 | 45,978 | 45,842 | 45,595 | 44,679 | ||||||
| Men | Women | 35,322 | 5,345 | 39,675 | 6,303 | 39,319 | 6,523 | 38,860 | 6,735 | 37,957 | 6,722 |
| Non-full time | 141 | 131 | 170 | 176 | 178 | ||||||
| Men | Women | 89 | 52 | 88 | 43 | 101 | 69 | 95 | 81 | 88 | 90 |
Percentage of contract workers
Fiscal 2022: 16.08% (sum of temporary employees and dispatched employees)
| Fiscal year | 2018 | 2019 | 2020 | 2021 | 2022 | ||||||
|---|---|---|---|---|---|---|---|---|---|---|---|
| General | 33,864 | 38,458 | 38,274 | 38,004 | 37,002 | ||||||
| Men | Women | 28,582 | 5,282 | 32,234 | 6,219 | 31,850 | 6,424 | 31,381 | 6,623 | 30,406 | 6,596 |
| Management and above | 6,784 | 7,507 | 7,544 | 7,591 | 7,677 | ||||||
| Men | Women | 6,721 | 63 | 7,423 | 84 | 7,445 | 99 | 7,479 | 112 | 7,551 | 126 |
| Executives *1 | 14 | 12 | 12 | 12 | 12 | ||||||
| Men | Women | 14 | 0 | 15 | 0 | 10 | 2 | 10 | 2 | 10 | 2 |
*1 Total number of Directors and Auditors
| Fiscal year | 2018 | 2019 | 2020 | 2021 | 2022 | ||||||
|---|---|---|---|---|---|---|---|---|---|---|---|
| Overall | 41.9 years | 42.3 years | 42.8 years | 42.9 years | 43.0 years | ||||||
| Men | Women | 42.8 years | 35.7 years | 43.7 years | 34.9 years | 43.7 years | 37.3 years | 43.8 years | 37.6 years | 43.9 years | 38.2 years |
| Fiscal year | 2018 | 2019 | 2020 | 2021 | 2022 | ||||||
|---|---|---|---|---|---|---|---|---|---|---|---|
| Average years of employment (year) |
22.14 | 21.76 | 21.67 | 21.69 | 21.75 | ||||||
| Men | Women | 23.04 | 16.20 | 22.66 | 16.07 | 22.58 | 16.18 | 22.60 | 16.41 | 22.59 | 17.01 |
| Turnover rate (%) |
0.55% | 0.84% | 0.78% | 0.84% | 1.08% | ||||||
| Men | Women | 0.40% | 1.53% | 0.69% | 3.69% | 0.68% | 2.55% | 0.75% | 2.23% | 0.98% | 2.72% |
| Retention rate (%) |
96.67% | 97.76% | 95.95% | 88.79% | 85.02% | ||||||
| Men | Women | 97.24% | 94.74% | 97.55% | 98.45% | 96.34% | 94.81% | 88.34% | 90.23% | 85.71% | 84.81% |
| Fiscal year | 2018 | 2019 | 2020 | 2021 | 2022 |
|---|---|---|---|---|---|
| Utilization rate (%) |
86.3 | 94.8 | 101.4 | 96.6 | 91.9 |
| Fiscal year | 2018 | 2019 | 2020 | 2021 | 2022 |
|---|---|---|---|---|---|
| Monthly average of overtime hours | 26 hours | 25 hours | 22 hours | 15 hours | 19 hours |
| Fiscal year | 2018 | 2019 | 2020 | 2021 | 2022 |
|---|---|---|---|---|---|
| Administrative staff | 74 (Including 16 *2) |
91 (Including 33 *2) |
78 (Including 22 *2) |
61 (Including 12 *2) |
40 (Including 23 *2) |
| Engineers | 536 (Including 202 *2) |
622 (Including 206 *2) |
538 (Including 154 *2) |
432 (Including 114 *2) |
337 (Including 81 *2) |
| Clerical workers | 36 | 36 | 39 | 27 | 13 |
| Technical and skilled workers *1 | 671 (Including 295 *3) |
898 (Including 426 *3) |
835 (Including 358 *3) |
595 (Including 116 *3) |
391 (Including 120 *3) |
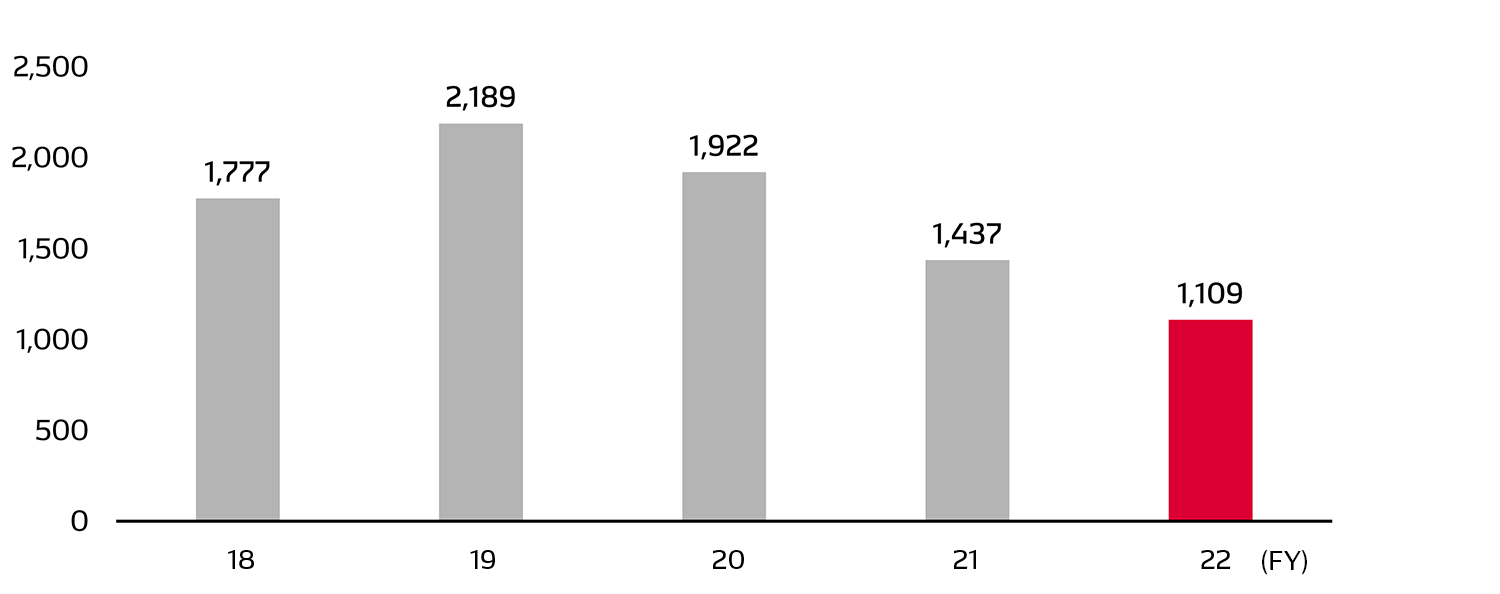
| Total | 1,317 | 1,647 | 1,490 | 1,115 | 781 |
*1 Including students of the DENSO Technical College
*2 Mid-career employment workers
*3 Permanent employees who have shifted from temporary employees
Initiatives for improving employee satisfaction [DENSO Corporation]
Employee Engagement Survey
Every year, we implement an engagement survey (called the Frontline Capabilities survey), targeting our entire employee base of roughly 50,000 employees.
| Fiscal year | 2021 | 2022 |
|---|---|---|
| Percentage of employees providing affirmative responses regarding work engagement* | 66 | 70 |
* Work engagement: Sense of fulfillment and connection to the workplace and DENSO as a whole. Work engagement is measured based on replies to four specific questions.
Human Resource Development
Proportion of local employees in overseas Group company management positions [outside Japan]
| Fiscal 2018 | Fiscal 2019 | Fiscal 2020 | Fiscal 2021 | Fiscal 2022 |
|---|---|---|---|---|
| 28% | 31% | 30% | 31% | 26% |
| (26persons / 92posts) | (26persons / 84posts) | (25persons / 82posts) | (25persons / 81posts) | (19persons / 74posts) |
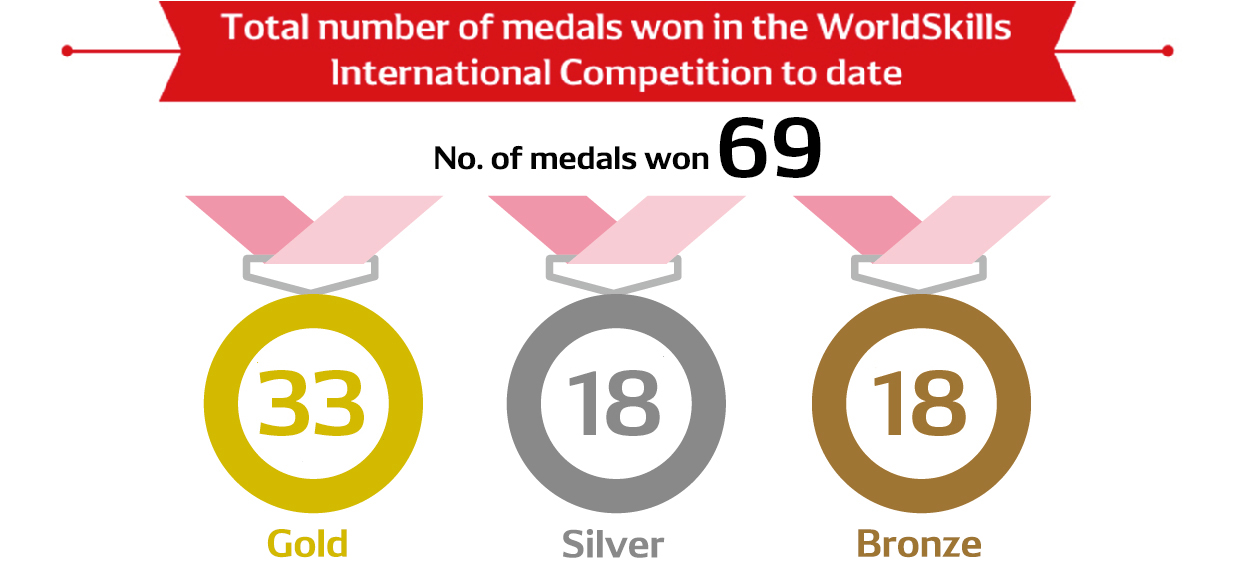
World Skills Competition cumulative medal count [DENSO Group] (as of August 2019)
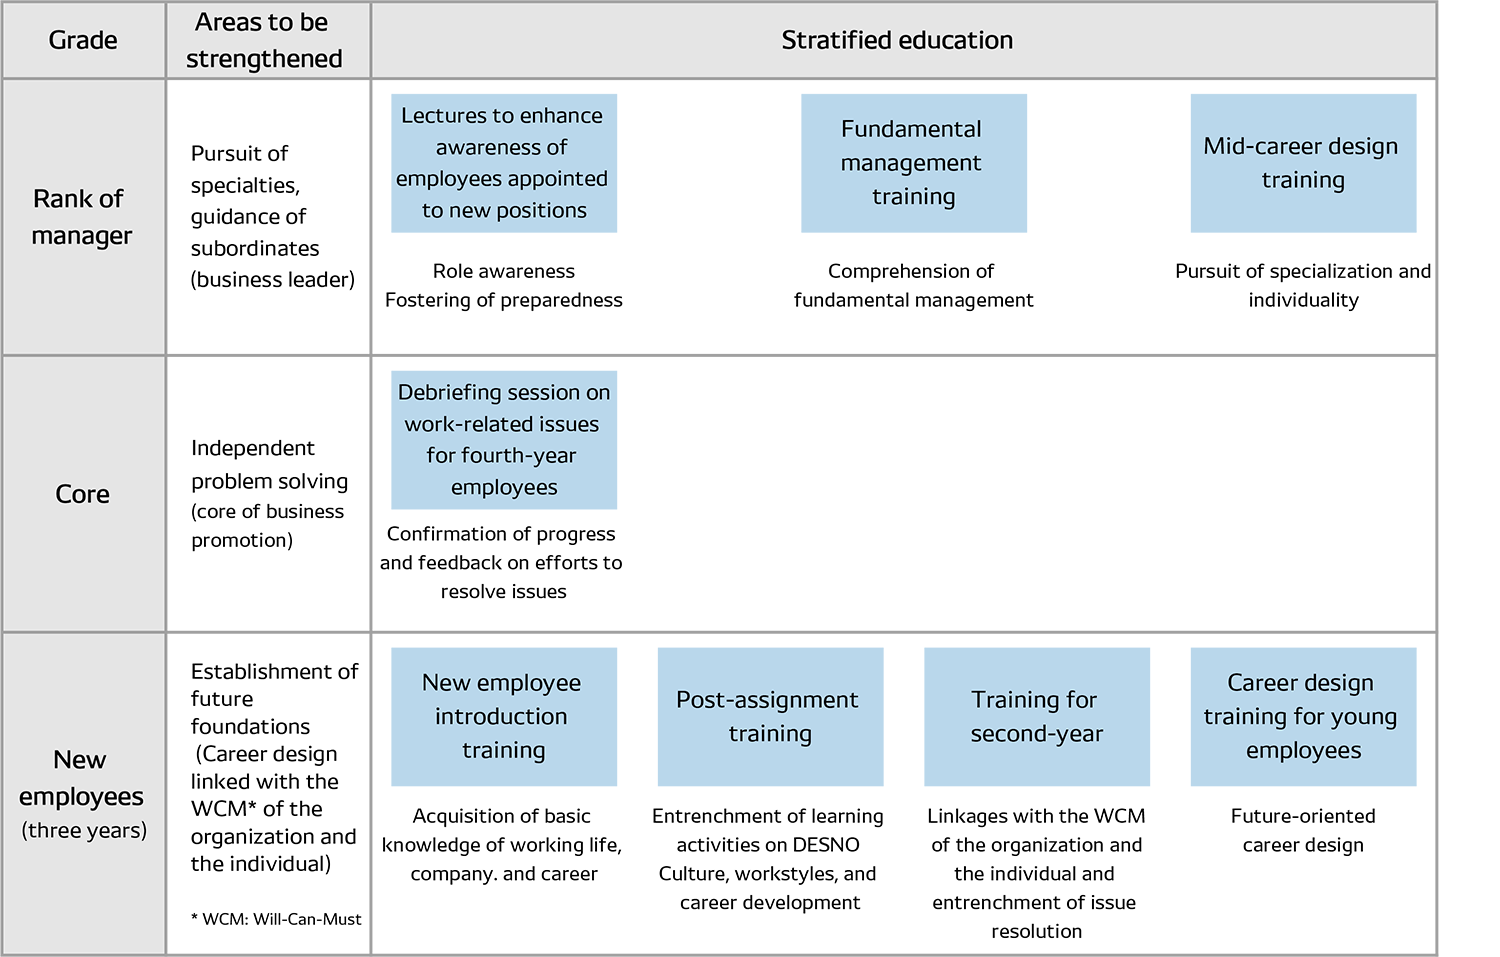
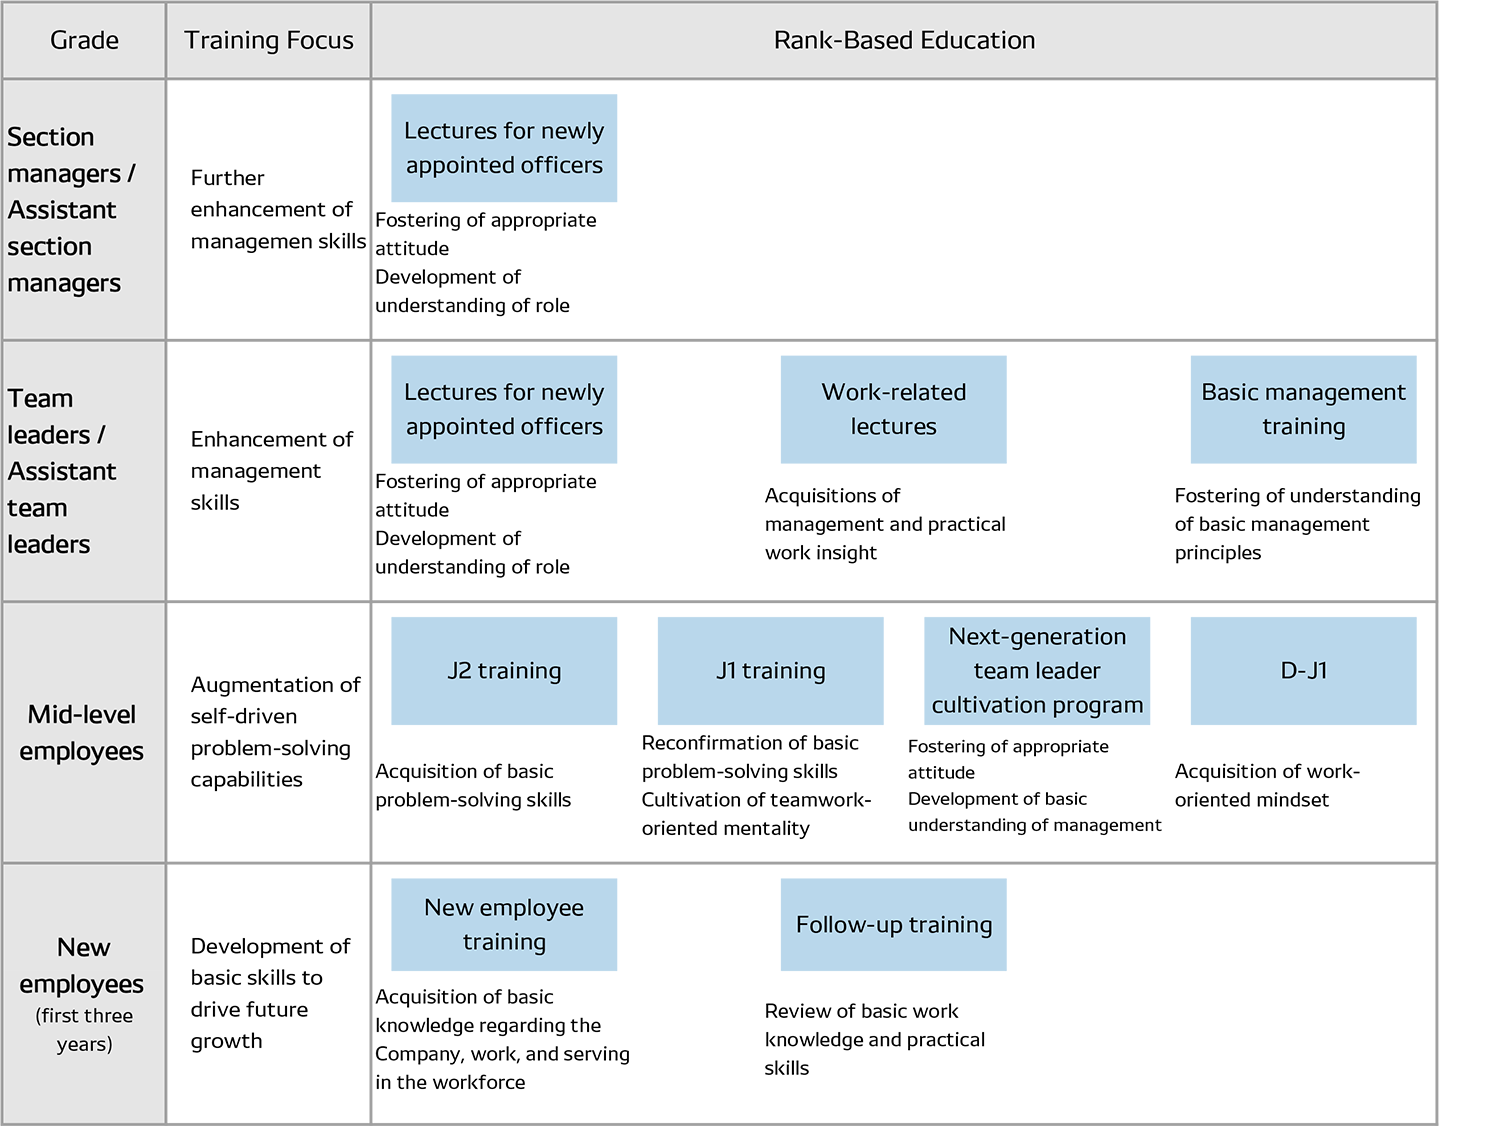
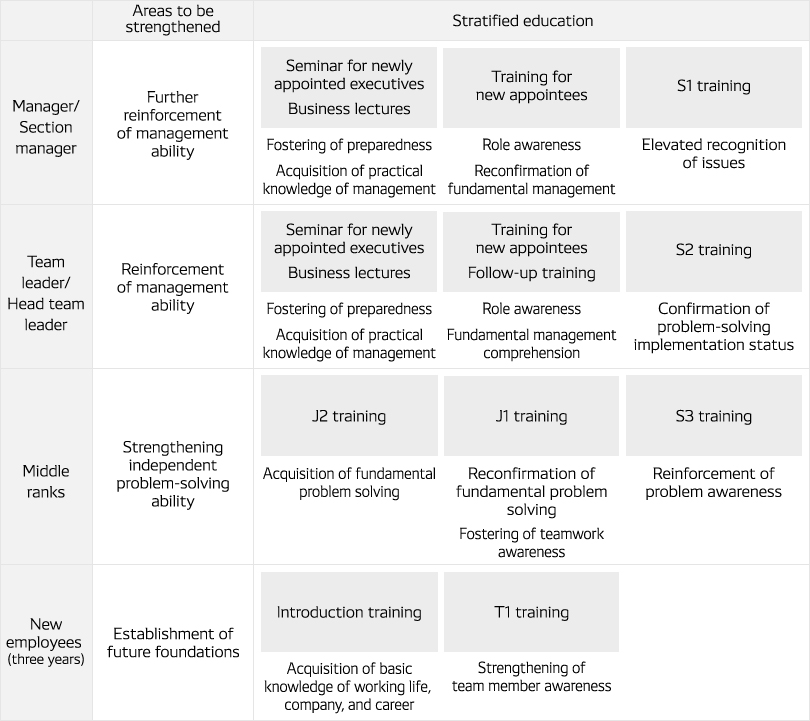
The completion of stratified education [DENSO Corporation]
To obtain our ideal human resources, we are striving to promote even more awareness of the roles demanded at each career turning point, while at the same time solidifying roles by putting this awareness promotion into practice in the workplace.
Management and above
Clerical and technical staff (non-manager)
Technical and skilled workers
Clerical workers
Total hours of rank-based education
| fiscal 2022 | 103,645 hours |
|---|
Respect for Human Rights
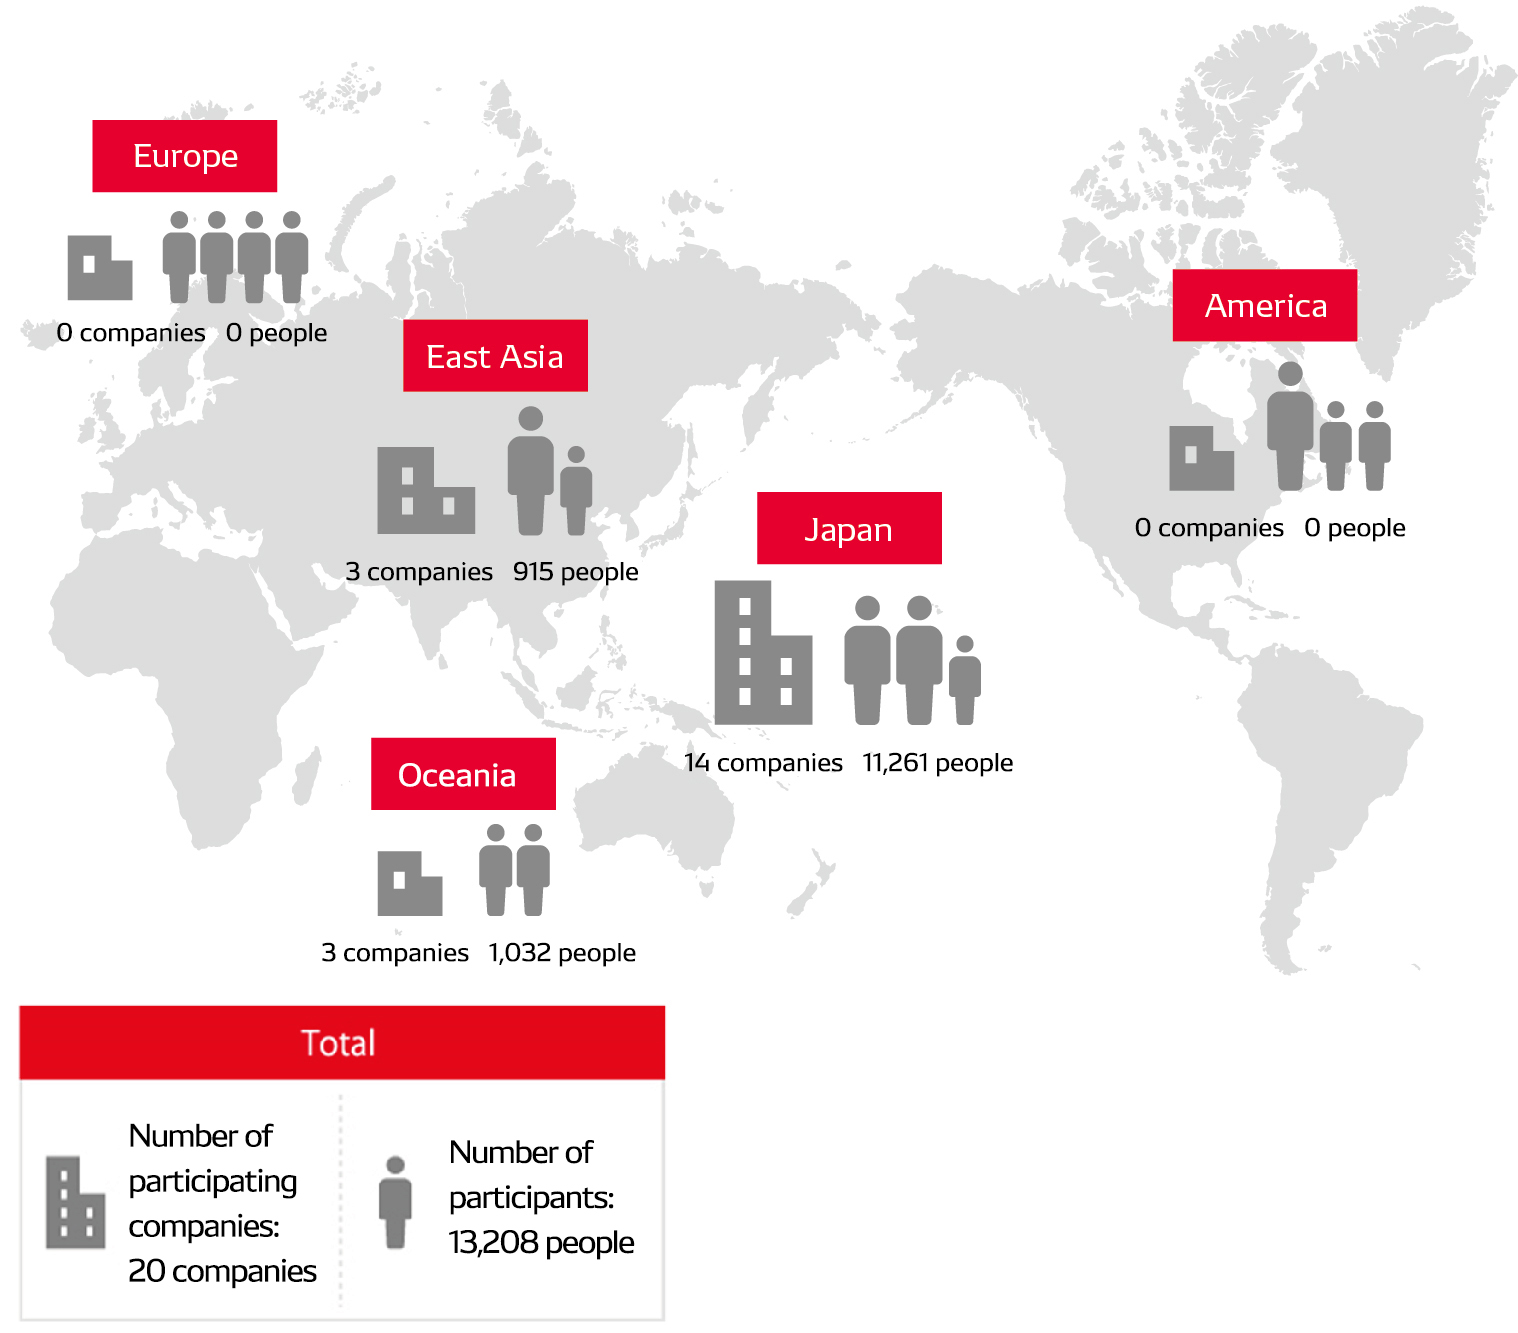
Individuals participating in a seminar on human rights* [DENSO Corporation]
* New employees, mid-career employees, contract employees, new level 3 management class
The total number of employees participating in educational activities in fiscal 2022 declined due to the decrease in the number of new employees.
Encouraging Diversity and Promoting a Work-Life Balance
Encouraging diversity [DENSO Corporation]
| Fiscal year | 2018 | 2019 | 2020 | 2021 | 2022 |
|---|---|---|---|---|---|
| Female employees | 5,345 (13.1%) |
5,674 (13.9%) |
6,529 (14.2%) |
6,631 (14.6%) |
6,710 (15.1%) |
| Senior employees (employed post-retirement age) |
1,869 | 3,396 | 3,406 | 3,679 | 4,053 |
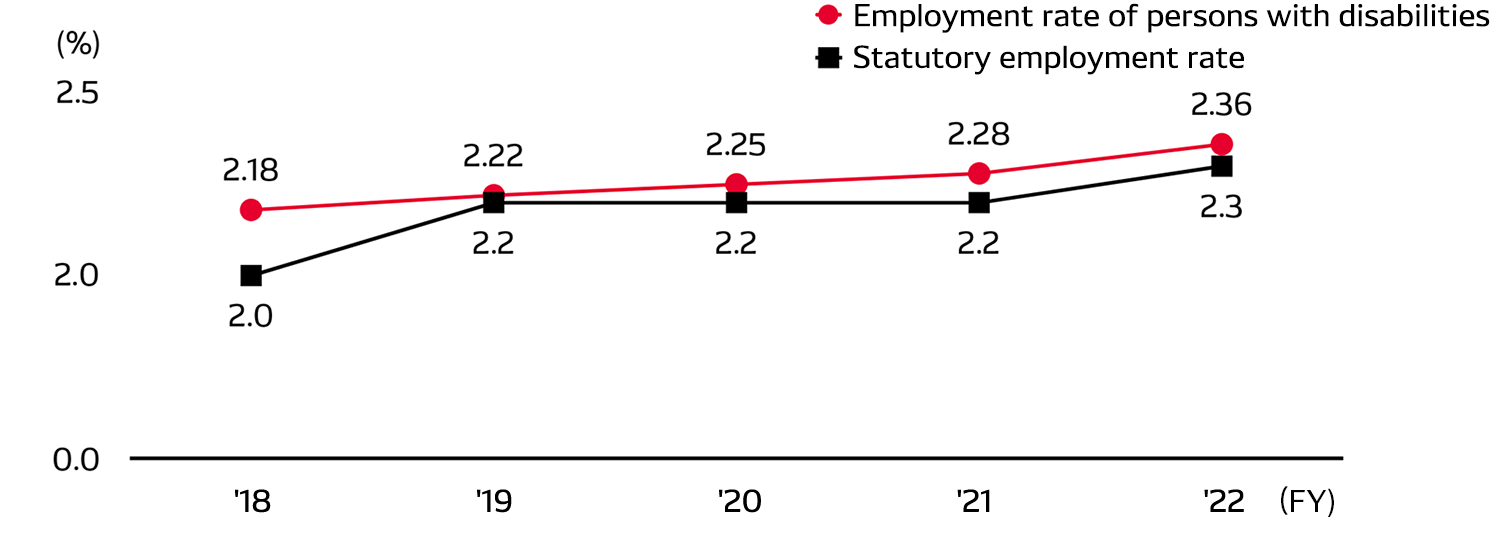
| Persons with disabilities*1 | 634 (2.18%) |
743 (2.22%) |
774 (2.25%) |
825 (2.28%) |
829 (2.36%) |
| Employees from overseas*2 | 260 | 286 | 369 | 278 | 231 |
*1:Total of DENSO Corporation, DENSO TAIYO Co., Ltd. and DENSO Blossom Co., Ltd. The figures in ( )represent employment ratios of persons with disabilities.
*2:Total employed by DENSO Corporation and assigned from overseas Group companies
Diversity Training for Managerial Personnel [DENSO CORPORATION]
Target personnel: Plant managers, division managers, and section managers
| Training schedule | November–December 2020 (total of six sessions) |
|---|---|
| Participants | 591 |
| Length of training session | Three hours |
| Total hours of training | 1,773 |
Promoting the active role of female employees
Number/Ratio*1 of new female graduates hired [DENSO Corporation]
| Fiscal year | 2018 | 2019 | 2020 | 2021 | 2022 | |
|---|---|---|---|---|---|---|
| Recruitment | General clerical | 28 48% |
24 41% |
29 52% |
25 48% |
5 29% |
| General technical and skilled | 52 16% |
58 14% |
54 14% |
46 14% |
31 12% |
|
| Technical and skilled*2 | 69 28% |
123 32% |
101 29% |
79 30% |
70 28% |
|
| Clerical | 36 100% |
29 94% |
19 100% |
27 100% |
3 100% |
|
| Total(%) | 27% | 26% | 25% | 24% | 18% | |
*1 Percentage figures are the ratio of female employees versus the overall employment number for respective job categories
*2 Excluding DENSO Technical College
Number of women in executive and management positions [DENSO Corporation]
| Fiscal year | 2018 | 2019 | 2020 | 2021 | 2022 |
|---|---|---|---|---|---|
| Executive *1 | 1 1.9% |
1 1.9% |
2 7.1% |
2 7.4% |
2 8.0% |
| Manager | 69 0.9% |
86 1.1% |
103 1.3% |
113 1.5% |
127 1.7% |
*1 Up to fiscal 2019: Directors, Audit & Supervisory Board members, executive directors, and senior executive directors. From fiscal 2020 onward: Directors, Audit & Supervisory Board members, and senior executive officers
Number of applicants of childcare and nursing care leave [DENSO CORPORATION]
| Fiscal year | 2018 | 2019 | 2020 | 2021 | 2022 | |
|---|---|---|---|---|---|---|
| Childcare leave | Female | 277 | 286 | 349 | 316 | 330 |
| Male | 32 | 45 | 57 | 123 | 269 | |
| Nursing care leave | Female | 7 | 8 | 9 | 2 | 5 |
| Male | 8 | 7 | 16 | 8 | 9 | |
| Reduced work hours for childcare | Female | 315 | 307 | 344 | 361 | 354 |
| Male | 3 | 2 | 6 | 9 | 10 | |
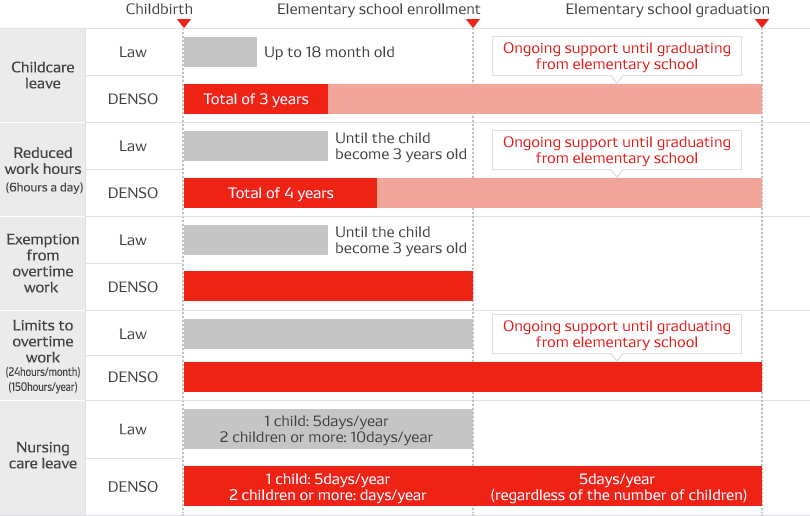
Childcare support [DENSO Corporation]
Nursing care support [DENSO Corporation]
Encouraging employment of persons with disabilities
Trends in employment rate of persons with disabilities [DENSO Corporation]
External evaluations of diversity initiatives [DENSO Corporation]
| 2016 |
Recognized as part of the Ministry of Economy, Trade and Industry’s Diversity Management Selection 100
|
|---|---|
| 2017 | Recipient of Company of Brilliance Award from Aichi Prefecture |
| 2018 |
Recipient of the Ministry of Health, Labour and Welfare's “Excellent Equal Opportunity / Work and Family-Life Balance Companies” award in the Family Friendly Company category. Received the Ministry of Health, Labour and Welfare’s Award for Excellence |
| 2019 | Winner of the 8th Japan HR Challenge Award Incentive Prize |
| 2021 | Continued to be recognized as a “Family Friendly Company” by Aichi Prefecture |
Safety and Health
Fiscal 2022 results [the DENSO Group]
In fiscal 2022, with a focused on preventing serious accidents, fires, and explosions and reducing the number of “Grade 1 accidents” involving moving parts of machinery and heavy objects, we offered safety-related communication provided by heads of each department and promoted safety-related activities in which all employees participated, including activities to strengthen disaster prevention through hands-on training involving the handling of abnormalities and explosion and fire prevention maintenance centered on high-risk equipment. With regard to domestic Group companies, certain safety-related targets were not reached due to an increase in the number of accidents. The results of an analysis on the factors that led to said accidents showed that there was a particularly high number of accidents regarding employees getting parts of their bodies stuck in the operating parts of production equipment. To that end, we implemented specialized training activities emphasizing the dangers of touching moving objects of machinery, and we will continue such activities on an ongoing basis with a view to preventing future accidents.
| DENSO Corporation | Group Companies(Japan) | Group Companies(Overseas) | |||||||
|---|---|---|---|---|---|---|---|---|---|
| Target | Result | Assessment | Target | Result | Assessment | Target | Result | Assessment | |
| Safety marks (Cases) |
50.0 | 32.0 (9) |
○ | 62.5 | 71.0 (18) |
× | 63.0 | 33.5 (12) |
○ |
| Lost time injury frequency | 0.04 | 0.03 | ○ | 0.06 | 0.10 | × | 0.10 | 0.00 | ○ |
| Number of major accidents* | 0 | 0 | ○ | 0 | 0 | ○ | 0 | 0 | ○ |
* Major accidents: Accidents involving fatalities or serious injuries
Fiscal 2022 Targets [the DENSO Group]
| DENSO Corporation | Group Companies(Japan) | Group Companies(Overseas) | |
|---|---|---|---|
| Target | Target | Target | |
| Safety marks (Cases) |
50.0 | 36.0 | 48.5 |
| Lost time injury frequency | 0.04 | 0.06 | 0.10 |
| Number of major accidents* | 0 | 0 | 0 |
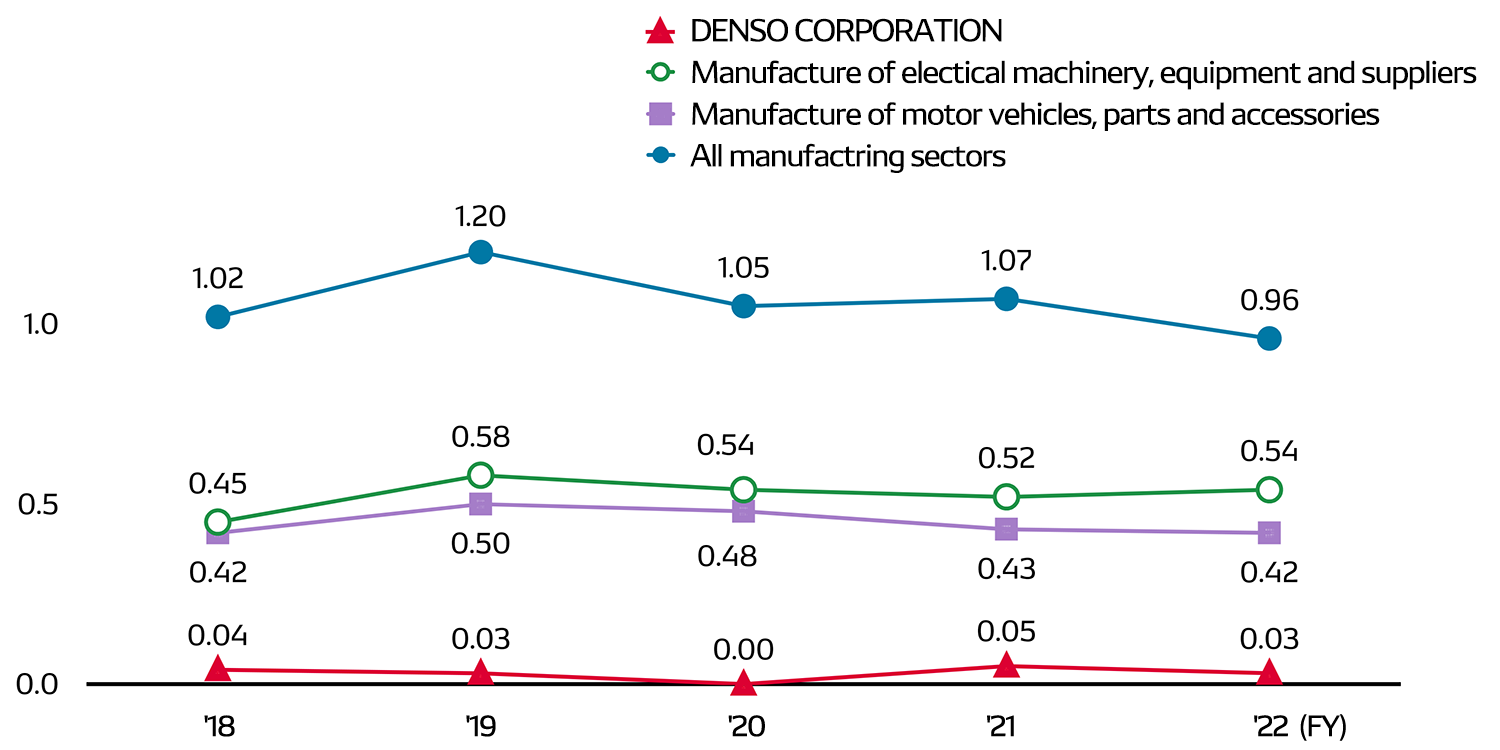
Trend in work-related accident ratio (Lost time injury frequency) [DENSO Corporation]
Trend in work-related accident ratio (Lost time injury frequency) [the DENSO Group]
| Fiscal year | 2018 | 2019 | 2020 | 2021 | 2022 |
|---|---|---|---|---|---|
| DENSO CORPORATION | 0.04 | 0.03 | 0.00 | 0.05 | 0.03 |
| Group Companies (Japan) | 0.05 | 0.05 | 0.05 | 0.05 | 0.10 |
| Group Companies (Overseas) | 0.04 | 0.01 | 0.02 | 0.03 | 0.00 |
Data Coverage : 67% (102 Companies out of 153 consolidated subsidiaries and manufacturing companies)
Safety marks (Scoring depending on scale and type of accidents. Lower number is better.) [the DENSO Group]
| Fiscal year | 2018 | 2019 | 2020 | 2021 | 2022 |
|---|---|---|---|---|---|
| DENSO CORPORATION | 25.0 | 26.0 | 24.0 | 46.0 | 32.0 |
| Group companies in Japan | 31.0 | 29.0 | 29.0 | 38.0 | 71.0 ※ |
| Group companies overseas | 46.5 | 40.5 | 38.0 | 29.0 | 33.5 ※ |
Data Coverage : 67% (102 Companies out of 153 consolidated subsidiaries and manufacturing companies)
* Worsening ratio due in part to the increase in the number of Group companies
Rank-based Safety and Health-Related Education in Fiscal 2022 [DENSO CORPORATION]
| Name of education program | Hours | Number of participants |
|---|---|---|
| Introductory training for new employees* | 0.5–1 | 3,440 |
| Safety training for mid-career employees | 8 | 531 |
| Safety, health, and environment training for newly appointed team leaders/assistant team leaders | 14 | 117 |
| Training for personnel selected as safety managers | 10 | 24 |
* Includes temporary employees
In addition to training by rank-based education, we also implement educational activities by job type for employees engaged in specific work and hazardous work.
Acquisition of Health and Safety Management System Certification [the DENSO Group]
Acquisition of ISO 45001 certification: 33 locations
Acquisition rate: 40%
(As of March 31, 2022)
Promoting Employee Health
Mental Health Case Study Training (Fiscal 2022) [DENSO Corporation]
| Participants | 489 |
|---|---|
| Number of sessions held | Total of two times (September 9 and 16) |
| Training time | 110 minutes |
| Participants | 274 |
|---|---|
| Number of sessions held | Total of 9 times (between June and July) |
| Training time | 1 hour 30 minutes |
Stress Check Completion Rate [DENSO Corporation]
| Fiscal year | 2020 | 2021 | 2022 |
|---|---|---|---|
| Number (percentage) of examination recipients | 49,976(96.5%) | 50,816(97.1%) | 49,169(97.0%) |
| Percentage of employees with high stress levels | 1.0% | 0.8% | 0.8% |
Percentage of Employees Receiving Regular Health Examinations [DENSO Corporation]
| Fiscal year | 2020 | 2021 | 2022 |
|---|---|---|---|
| Receipt rate | 100% | 100% | 100% |
Percentage of Employees Receiving Complete Physicals [DENSO Corporation]
| Fiscal year | 2020 | 2021 | 2022 |
|---|---|---|---|
| Receipt rate | 57.6% | 61.5% | 59.0% |
Status of Participation in and Management of Specialized Health Guidance Sessions [DENSO Corporation]
| Fiscal year | 2020 | 2021 | 2022 |
|---|---|---|---|
| Percentage of employees targeted | 26.2% | 26.4% | 24.6% |
| Participation rate | 51.4% | 32.1% | 86.7% |
| Completion rate | 38.7% | 25.4% | 67.6% |
Level of Satisfaction with DENSO Group Health Seminars (Commenced in Fiscal 2022, High Score of 10) [DENSO Group (Japan)]
| Fiscal year | 2022 | 2023 ※ |
|---|---|---|
| Level of satisfaction | 7.8 | 8.3 ※ As of June 2022 |
Status of Employees’ Health Maintenance (Lifestyle Score) [DENSO Corporation]
The “Lifestyle Score” is a DENSO-original index that provides a score of employees’ lifestyles based on the results of regular health examinations. The Companywide average Lifestyle Score is managed as a Company target and has been assessed twice a year since fiscal 2018.
| Fiscal year | 2020 | 2021 | 2022 |
|---|---|---|---|
| Target | 73.0 | 74.5 | 76.0 |
| Results | 71.4 | 72.4 | 74.1 |
Indicators for health examination results [DENSO Corporation]
| Fiscal year | 2020 | 2021 | 2022 |
|---|---|---|---|
| Ratio of employees at a reasonable weight | 61.7% | 60.6% | 64.5% |
| Ratio of employees who exercise regularly *1 | 13.3% | 14.8% | 17.7% |
| Ratio of employees engaged in physical activities *2 | 46.7% | 43.2% | 45.2% |
| Ratio of employees who receive adequate rest via sleep | 75.3% | 78.1% | 78.0% |
| Ratio of employees who drink alcohol *3 | 21.1% | 19.0% | 18.1% |
| Ratio of employees who do not eat dinner within two hours before going to bed *4 | 64.3% | 71.4% | 71.4% |
| Ratio of employees who eat breakfast *5 | 86.2% | 86.7% | 86.2% |
| Ratio of employees who eat at a normal pace *6 | 51.5% | 52.3% | 52.5% |
| Ratio of employees who have gained less than 10 kg since they were 20 years old | 60.0% | 59.6% | 59.4% |
*1 Ratio of employees who answered “yes” to the question, “Have you been exercising for two days a week or more for at least 30 minutes each time for over a year?”
*2 Ratio of employees who answered “yes” to the question, “In your daily life, do you walk or engage in an equivalent physical activity for at least one hour per day?”
*3 Ratio of employees who stated that they drink often or every day and that they drink the equivalent of two glasses of Japanese sake on days that they do drink.
*4 Ratio of employees who answered “no” to the question, “Do you eat dinner within two hours before going to bed three times a week or more?”
*5 Ratio of employees who answered “no” to the question, “Do you go without eating breakfast three times a week or more?”
*6 Ratio of employees who answered “normal” or “slow” to the question, “How fast do you eat compared with other people?”
Trend in Non-Smoking Rates [DENSO Corporation]
| Fiscal year | 2020 | 2021 | 2022 |
|---|---|---|---|
| Non-Smoking Rates | 73.9% | 74.4% | 75.6% |
Ratio of Employees Taking Absence Due to Injury or Illness (Absenteeism) [DENSO Corporation]
| Fiscal year | 2020 | 2021 | 2022 |
|---|---|---|---|
| Ratio of Employees Taking Absence | 2.7% | 2.6% | 2.8% |
Presenteeism *1 [DENSO Corporation]
| Fiscal year | 2020 | 2021 | 2022 |
|---|---|---|---|
| Overall work evaluation within the WLQ *2 | 94.7% | 95.0% | 95.0% |
*1 Refers to the lost productivity and work output that occurs when employees are not fully functioning in the workplace because of an illness, injury, or other condition.
*2 Work Limitations Questionnaire (WLQ): A questionnaire regarding the percentage of work hours and frequency in which employees do not perform their duties due to poor physical health.


