Charts and Graphs
Color usage
Primary color scheme for charts
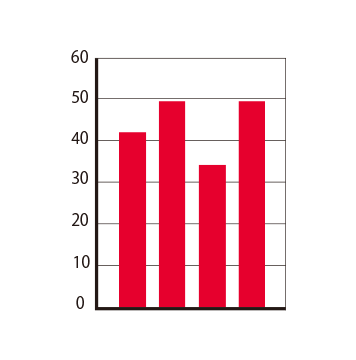
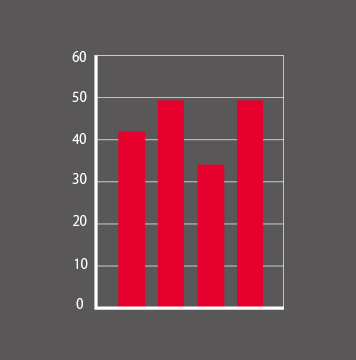
An order of colors has been defined for charts prioritizing the primary DENSO Red and the supplementary dark red and pink shades.
Please note: When using only two colors, Red is always one of them.
Alternative 1 ― Blue charts
You may also choose to use the primary Craft ing Blue with the supplementary blue hues as long as the primary DENSO Red is used elsewhere in a given application. Please note that color 7 is a tint of Deep Blue.
Please note: When using only two colors, Blue is always one of them.
Alternative 2 ― Visualizing sustainability
Supplementary greens in combination with secondary grays may be used for charts and infographics illustrating "green" and sustainability issues as long as the primary DENSO Red is used elsewhere in a given application.
Primary color scheme for charts
Color order for charts on white, Crafting Blue and secondary gray backgrounds
-
1
Deep Red
-
2
Dark Red
-
3
DENSO Red
-
4
Dark Pink
-
5
Pink
-
6
Light Pink
-
7
60% Light Pink
Alternative color schemes for charts
Alternative 1 ― Blue charts
Color order for blue charts on white, Crafting Blue and DENSO Gray 1 & 5 background
-
1
Crafting Blue
-
2
Bright Blue
-
3
Blue
-
4
Medium Blue
-
5
Dark Blue
-
6
Deep Blue
-
7
70% Deep Blue
-

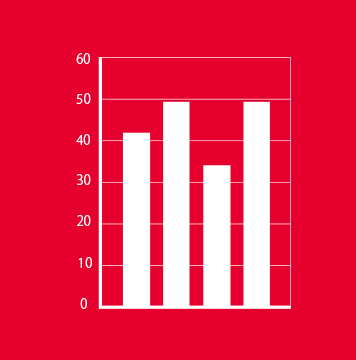
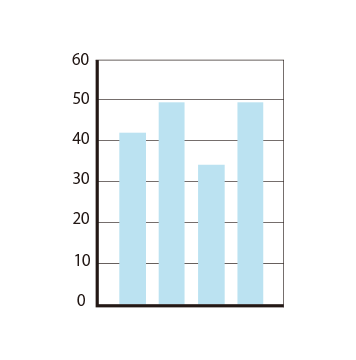
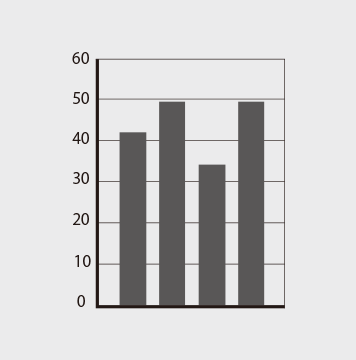
Blue chart on white background
-

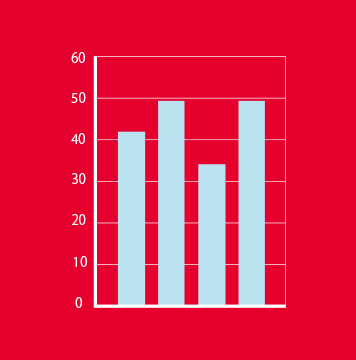
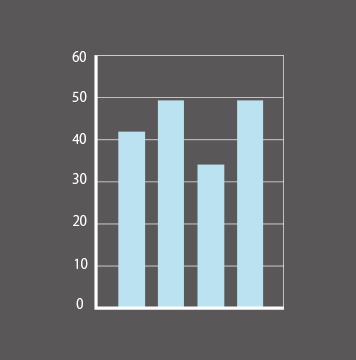
Blue chart on Crafting Blue background – Please note: Color 1 changed to 50% Dark Blue.
-

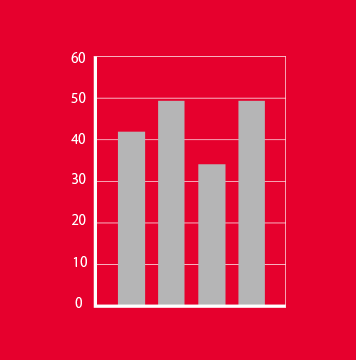
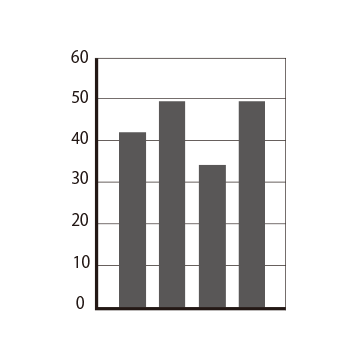
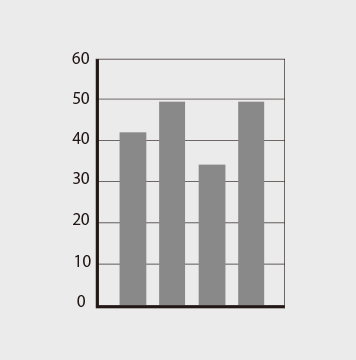
Blue chart on DENSO Gray 5 background
-

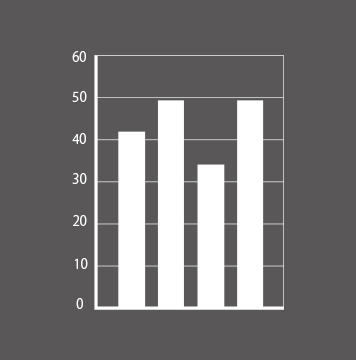
Blue chart on DENSO Gray 1 background
Alternative 2 ― Visualizing Sustainability
Green charts may be placed on white, Crafting Blue and DENSO Gray 5 background.
Please note: On DENSO Gray 5 background Color 7 changed to 60% DENSO Gray .5
-
1
Light Green
-
2
Green
-
3
Dark Green
-
4
DENSO Gray 2
-
5
DENSO Gray 3
-
6
DENSO Gray 4
-
7
DENSO Gray 5
-

Green chart on white background
-

Green chart on Crafting Blue background
-

Green chart on DENSO Gray 5 background – Please note: Color 7 changed to 60% DENSO Gray 5.
Alternative colors for charts – examples
Alternative: Use of the blue color range
The blue color range including Crafting Blue may also be used for charts when DENSO Red is also used, such as for highlighting significant numbers or pointers.
Exception: Use of the green color range
The supplementary green colors may be used in charts with specific focus on sustainability and environmental issues when DENSO Red is also used, such as for highlighting significant numbers, or is present elsewhere in the layout.
Charts on photo background
Chart/infographic on photo background
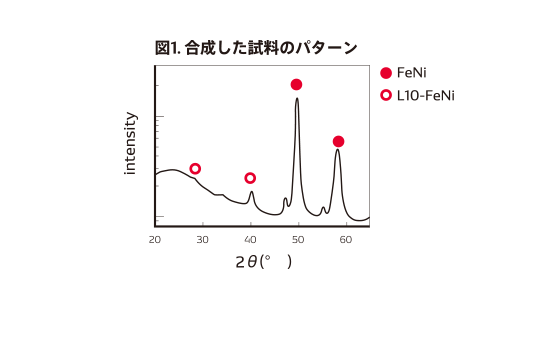
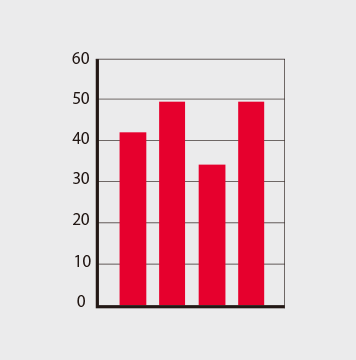
Simple charts on top of photos are in DENSO Red and white or a shade of DENSO Gray depending on the color contrast.
Chart and diagram examples
DENSO Red is our primary brand color and may be amplified by using shades of red/pink from the supplementary palette.
DENSO Red is reserved for highlighting the message we want to get across the most.
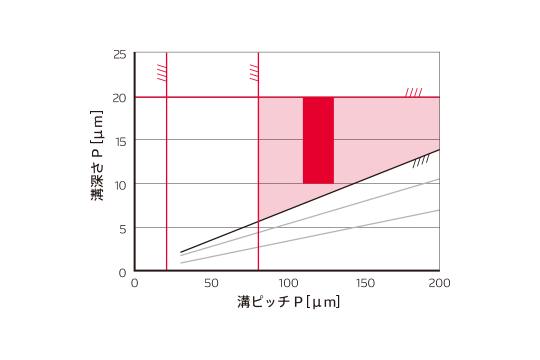
Area Graphs
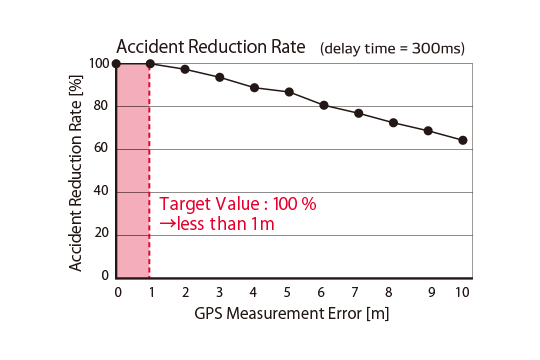
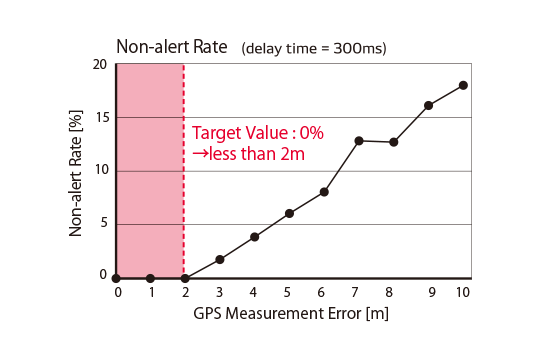
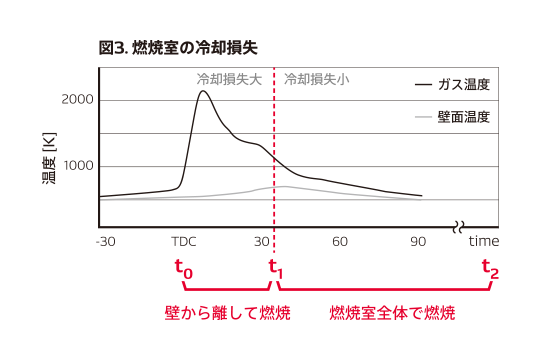
Charts and graphs are important elements in maintaining the uniqueness of DENSO. Use DENSO Red as the primary color and DENSO Gray as the secondary color. In particular, when comparing DENSO with other companies in a chart or graph, use DENSO Red for DENSO items or areas that you want to emphasize.
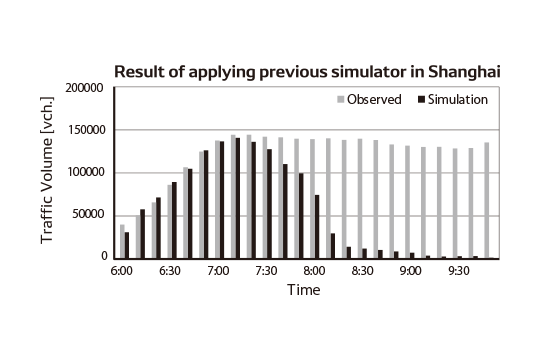
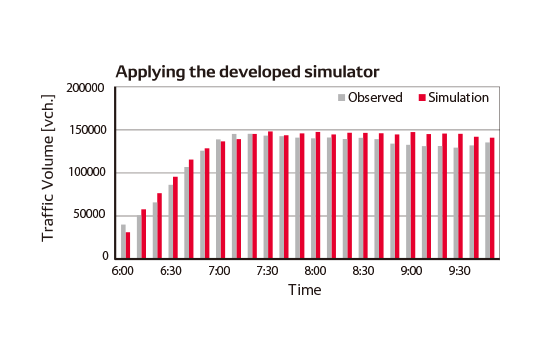
Bar Graphs
Charts and graphs are important elements in maintaining the uniqueness of DENSO. Use DENSO Red as the primary color and DENSO Gray as the secondary color. In particular, when comparing DENSO with other companies in a chart or graph, use DENSO Red for DENSO items or areas that you want to emphasize.
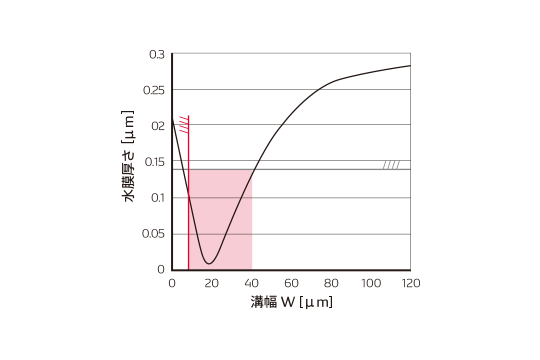
Line Graphs
Charts and graphs are important elements in maintaining the uniqueness of DENSO. Use DENSO Red as the primary color and DENSO Gray as the secondary color. In particular, when comparing DENSO with other companies in a chart or graph, use DENSO Red for DENSO items or areas that you want to emphasize.
Analog Graphs
Charts and graphs are important elements in maintaining the uniqueness of DENSO. Use DENSO Red as the primary color and DENSO Gray as the secondary color. In particular, when comparing DENSO with other companies in a chart or graph, use DENSO Red for DENSO items or areas that you want to emphasize.
Table Charts

Combination Examples


